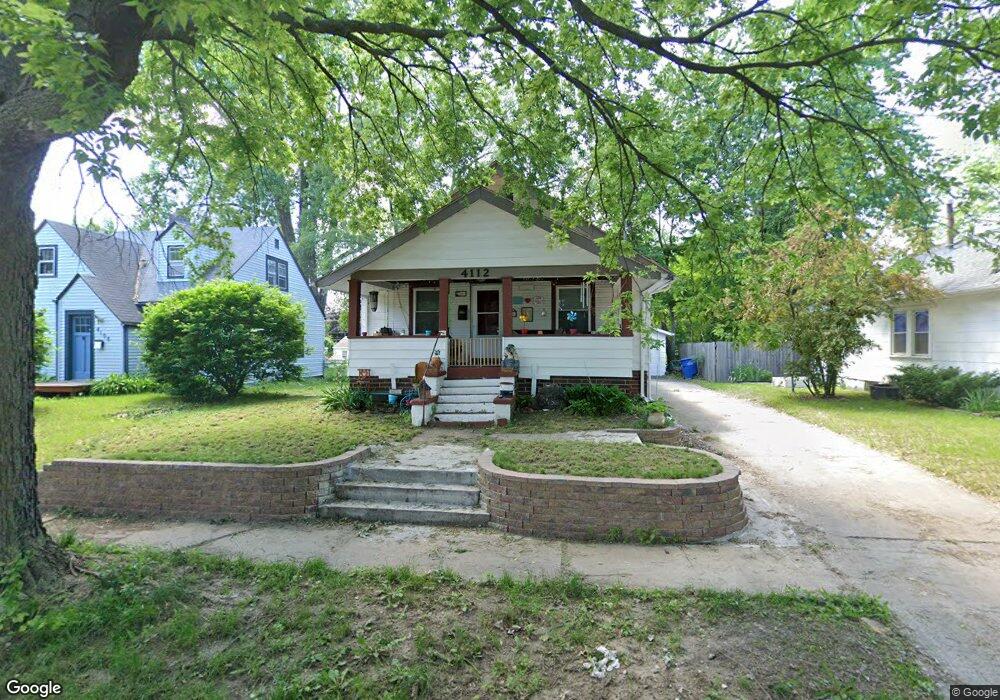
4112 3rd St Des Moines, IA 50313
Highland Park NeighborhoodEstimated Value: $166,000 - $226,000
5
Beds
1
Bath
1,193
Sq Ft
$159/Sq Ft
Est. Value
About This Home
This home is located at 4112 3rd St, Des Moines, IA 50313 and is currently estimated at $189,402, approximately $158 per square foot. 4112 3rd St is a home located in Polk County with nearby schools including Oak Park Elementary School, Harding Middle School, and North High School.
Ownership History
Date
Name
Owned For
Owner Type
Purchase Details
Closed on
Mar 25, 2021
Sold by
Marchant Monte
Bought by
Move Up Llc
Current Estimated Value
Purchase Details
Closed on
Jan 26, 2012
Sold by
Bennett Jacob R and Bennett Patricia L
Bought by
Bennett Jacob R
Home Financials for this Owner
Home Financials are based on the most recent Mortgage that was taken out on this home.
Original Mortgage
$93,000
Interest Rate
3.19%
Mortgage Type
New Conventional
Purchase Details
Closed on
Apr 23, 2009
Sold by
Dynamic Enterprises Corp
Bought by
Bennett Jacob R and Bennett Patricia L
Home Financials for this Owner
Home Financials are based on the most recent Mortgage that was taken out on this home.
Original Mortgage
$98,188
Interest Rate
5.05%
Mortgage Type
FHA
Purchase Details
Closed on
Jun 13, 2008
Sold by
Wells Fargo Bank Na
Bought by
Dynamic Enterprises Corp
Purchase Details
Closed on
Mar 13, 2008
Sold by
Gering Jerry and Gering Christine L
Bought by
Wells Fargo Bank Na
Purchase Details
Closed on
Feb 8, 2005
Sold by
Gering Jerry and Gering Christine L
Bought by
Gering Jerry and Gering Christine L
Home Financials for this Owner
Home Financials are based on the most recent Mortgage that was taken out on this home.
Original Mortgage
$67,700
Interest Rate
5.78%
Mortgage Type
New Conventional
Create a Home Valuation Report for This Property
The Home Valuation Report is an in-depth analysis detailing your home's value as well as a comparison with similar homes in the area
Home Values in the Area
Average Home Value in this Area
Purchase History
| Date | Buyer | Sale Price | Title Company |
|---|---|---|---|
| Move Up Llc | -- | None Listed On Document | |
| Bennett Jacob R | -- | None Available | |
| Bennett Jacob R | $99,500 | None Available | |
| Dynamic Enterprises Corp | $44,500 | None Available | |
| Wells Fargo Bank Na | $76,162 | None Available | |
| Gering Jerry | -- | -- |
Source: Public Records
Mortgage History
| Date | Status | Borrower | Loan Amount |
|---|---|---|---|
| Previous Owner | Bennett Jacob R | $93,000 | |
| Previous Owner | Bennett Jacob R | $98,188 | |
| Previous Owner | Gering Jerry | $67,700 |
Source: Public Records
Tax History Compared to Growth
Tax History
| Year | Tax Paid | Tax Assessment Tax Assessment Total Assessment is a certain percentage of the fair market value that is determined by local assessors to be the total taxable value of land and additions on the property. | Land | Improvement |
|---|---|---|---|---|
| 2025 | $3,100 | $181,300 | $28,800 | $152,500 |
| 2024 | $3,100 | $157,600 | $25,000 | $132,600 |
| 2023 | $3,040 | $157,600 | $25,000 | $132,600 |
| 2022 | $3,018 | $129,000 | $21,700 | $107,300 |
| 2021 | $2,784 | $129,000 | $21,700 | $107,300 |
| 2020 | $2,894 | $111,600 | $18,900 | $92,700 |
| 2019 | $2,650 | $111,600 | $18,900 | $92,700 |
| 2018 | $2,624 | $98,600 | $16,400 | $82,200 |
| 2017 | $2,416 | $98,600 | $16,400 | $82,200 |
| 2016 | $2,354 | $89,300 | $14,800 | $74,500 |
| 2015 | $2,354 | $89,300 | $14,800 | $74,500 |
| 2014 | $2,452 | $92,300 | $15,000 | $77,300 |
Source: Public Records
Map
Nearby Homes