J
Seller's Agent in 2025
Jo Johnson
RE/MAX
(319) 231-4887
49 Total Sales
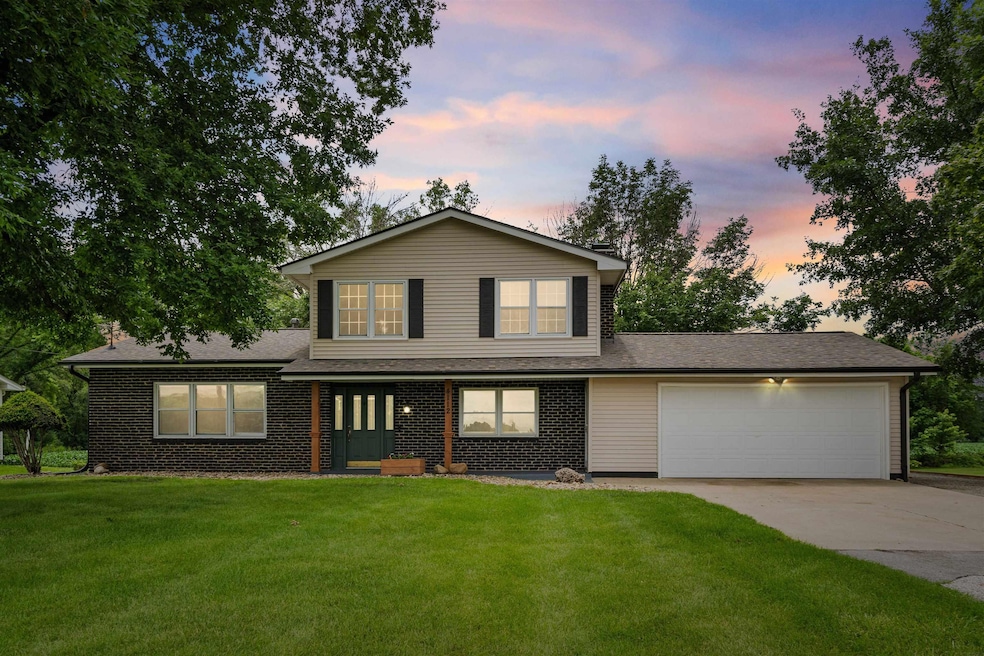
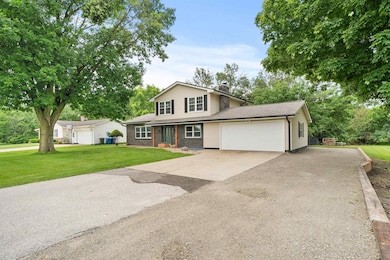
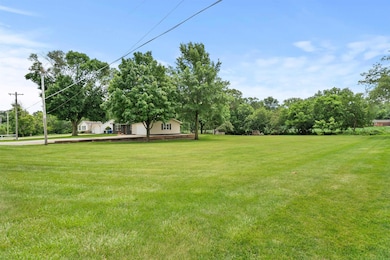
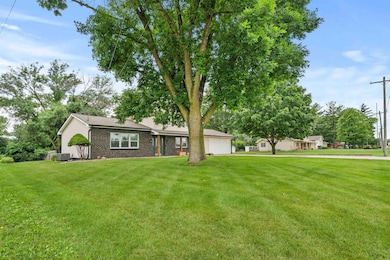
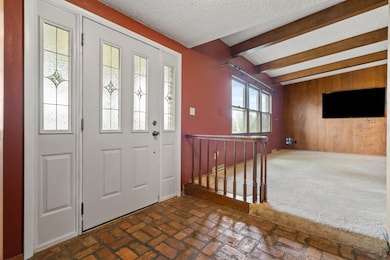

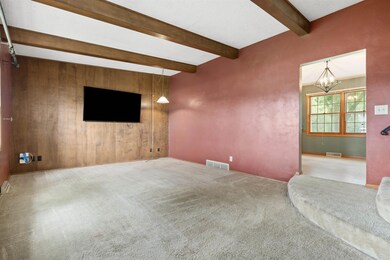
Welcome to your future home! Nestled in a beautiful setting on nearly one acre of land—this double lot offers ample space, privacy, and a rare opportunity to own a slice of peace just minutes from everything. Located directly across from miles of scenic bike trails and less than two miles from a popular water park and music venue, this property offers both tranquility and convenience. It’s the perfect place to enjoy nature, host gatherings, or simply relax in a spacious outdoor environment that’s ideal for entertaining. Inside, you'll find a well-maintained 3-bedroom, 2-bathroom home with a spacious and functional layout. The large kitchen is perfect for meal prep and family meals, while the living room—with its warm wood beam detailing—and the cozy family room with a fireplace offer great spaces to unwind or entertain guests. Major updates have already been completed for your peace of mind, including a new roof, furnace, air conditioning, and gutters/downspouts—all within the last five years. This home offers the best of both worlds: indoor comfort and outdoor enjoyment. Don’t miss your chance—call your realtor today to learn more about the opportunities this incredible double lot property offers!
Last Agent to Sell the Property
RE/MAX Concepts - Waterloo License #S64774000 Listed on: 06/26/2025

| Date | Type | Sale Price | Title Company |
|---|---|---|---|
| Warranty Deed | $267,000 | Title Services Corporation | |
| Warranty Deed | $175,000 | None Listed On Document | |
| Joint Tenancy Deed | $160,000 | Title Services |
| Date | Status | Loan Amount | Loan Type |
|---|---|---|---|
| Open | $166,875 | New Conventional | |
| Previous Owner | $175,000 | VA | |
| Previous Owner | $150,269 | Purchase Money Mortgage |
| Date | Event | Price | List to Sale | Price per Sq Ft |
|---|---|---|---|---|
| 09/19/2025 09/19/25 | Sold | $266,875 | -2.5% | $149 / Sq Ft |
| 08/13/2025 08/13/25 | Pending | -- | -- | -- |
| 08/07/2025 08/07/25 | Price Changed | $273,750 | -1.4% | $152 / Sq Ft |
| 07/23/2025 07/23/25 | Price Changed | $277,500 | -2.6% | $155 / Sq Ft |
| 07/16/2025 07/16/25 | Price Changed | $285,000 | -2.4% | $159 / Sq Ft |
| 07/07/2025 07/07/25 | Price Changed | $291,900 | -2.7% | $163 / Sq Ft |
| 06/26/2025 06/26/25 | For Sale | $299,900 | -- | $167 / Sq Ft |
| Year | Tax Paid | Tax Assessment Tax Assessment Total Assessment is a certain percentage of the fair market value that is determined by local assessors to be the total taxable value of land and additions on the property. | Land | Improvement |
|---|---|---|---|---|
| 2025 | -- | $247,120 | $23,730 | $223,390 |
| 2024 | $4,014 | $230,540 | $23,730 | $206,810 |
| 2023 | $4,014 | $230,540 | $23,730 | $206,810 |
| 2022 | $4,244 | $198,450 | $23,730 | $174,720 |
| 2021 | $4,118 | $198,450 | $23,730 | $174,720 |
| 2020 | $4,052 | $181,810 | $23,730 | $158,080 |
| 2019 | $4,052 | $181,810 | $23,730 | $158,080 |
| 2018 | $4,054 | $181,810 | $23,730 | $158,080 |
| 2017 | $4,366 | $181,810 | $23,730 | $158,080 |
| 2016 | $4,314 | $190,130 | $23,730 | $166,400 |
| 2015 | $4,314 | $190,130 | $23,730 | $166,400 |
| 2014 | $4,204 | $181,810 | $23,730 | $158,080 |
J
Seller's Agent in 2025
Jo Johnson
RE/MAX
(319) 231-4887
49 Total Sales
Seller Co-Listing Agent in 2025
Karen Kayser
RE/MAX
(319) 493-2402
175 Total Sales
Buyer's Agent in 2025
Christine Friedly
Oakridge Real Estate
(319) 830-2332
8 Total Sales
Source: Northeast Iowa Regional Board of REALTORS®
MLS Number: NBR20252969
APN: 8812-17-101-007
Disclaimer: Certain information contained herein is derived from information provided by parties other than Homes.com. All information provided is deemed reliable, but is not guaranteed to be accurate and should be independently verified.
![]() Based on information submitted to the MLS GRID. All data is obtained from various sources and may not have been verified by broker or MLS GRID. Supplied Open House Information is subject to change without notice. All information should be independently reviewed and verified for accuracy. Properties may or may not be listed by the office/agent presenting the information. Some IDX listings have been excluded from this website. IDX information is provided exclusively for personal, non-commercial use, and may not be used for any purpose other than to identify prospective properties consumers may be interested in purchasing. Information is deemed reliable but not guaranteed.
Based on information submitted to the MLS GRID. All data is obtained from various sources and may not have been verified by broker or MLS GRID. Supplied Open House Information is subject to change without notice. All information should be independently reviewed and verified for accuracy. Properties may or may not be listed by the office/agent presenting the information. Some IDX listings have been excluded from this website. IDX information is provided exclusively for personal, non-commercial use, and may not be used for any purpose other than to identify prospective properties consumers may be interested in purchasing. Information is deemed reliable but not guaranteed.
Based on information submitted to the MLS GRID
Ask me questions while you tour the home.