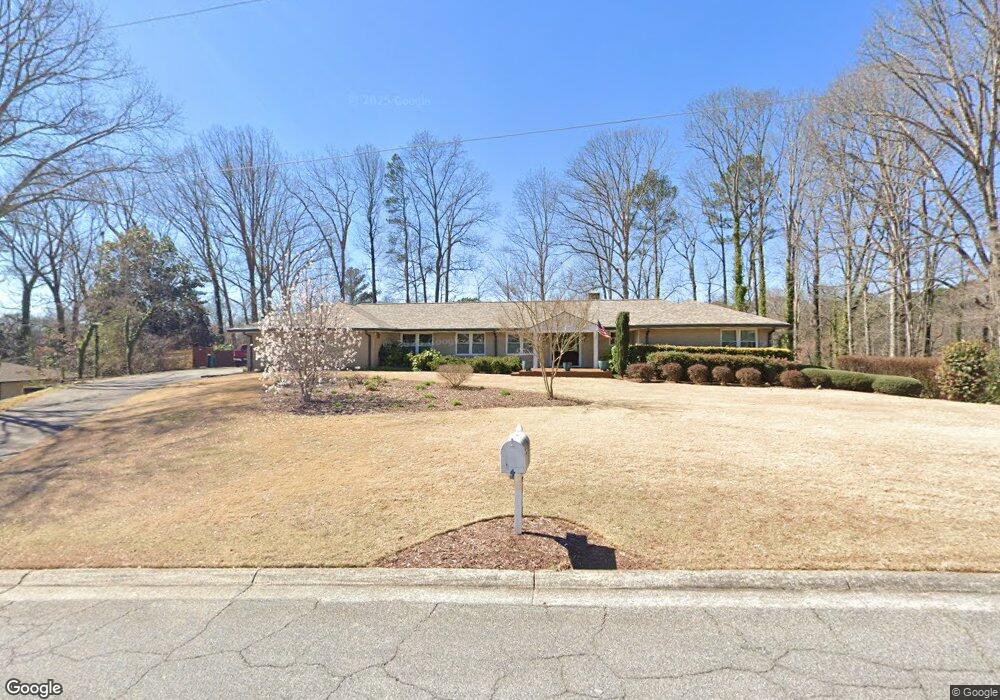
4112 Manson Ave SE Smyrna, GA 30082
Estimated Value: $566,761 - $632,000
4
Beds
4
Baths
2,388
Sq Ft
$254/Sq Ft
Est. Value
About This Home
This home is located at 4112 Manson Ave SE, Smyrna, GA 30082 and is currently estimated at $605,690, approximately $253 per square foot. 4112 Manson Ave SE is a home located in Cobb County with nearby schools including King Springs Elementary School, Griffin Middle School, and Campbell High School.
Ownership History
Date
Name
Owned For
Owner Type
Purchase Details
Closed on
Nov 4, 2022
Sold by
Marschark Ryan
Bought by
Ryan Samuel Marschark Revocable Trust and Kari Lynn Marschark Revocable Trust
Current Estimated Value
Purchase Details
Closed on
Nov 20, 2020
Sold by
Stallworth Augustus and Stallworth Constance
Bought by
Marschark Ryan and Marschark Karl
Home Financials for this Owner
Home Financials are based on the most recent Mortgage that was taken out on this home.
Original Mortgage
$427,500
Interest Rate
2.8%
Mortgage Type
New Conventional
Purchase Details
Closed on
Aug 5, 2013
Sold by
Jones David L
Bought by
Stallworth Augustus and Stallworth Donstance
Home Financials for this Owner
Home Financials are based on the most recent Mortgage that was taken out on this home.
Original Mortgage
$100,000
Interest Rate
4.29%
Mortgage Type
New Conventional
Purchase Details
Closed on
Oct 13, 2006
Sold by
Jones Ruby V
Bought by
Jones David L
Create a Home Valuation Report for This Property
The Home Valuation Report is an in-depth analysis detailing your home's value as well as a comparison with similar homes in the area
Home Values in the Area
Average Home Value in this Area
Purchase History
| Date | Buyer | Sale Price | Title Company |
|---|---|---|---|
| Ryan Samuel Marschark Revocable Trust | -- | -- | |
| Marschark Ryan | $450,000 | None Available | |
| Stallworth Augustus | $200,000 | -- | |
| Jones David L | -- | -- |
Source: Public Records
Mortgage History
| Date | Status | Borrower | Loan Amount |
|---|---|---|---|
| Previous Owner | Marschark Ryan | $427,500 | |
| Previous Owner | Stallworth Augustus | $100,000 |
Source: Public Records
Tax History Compared to Growth
Tax History
| Year | Tax Paid | Tax Assessment Tax Assessment Total Assessment is a certain percentage of the fair market value that is determined by local assessors to be the total taxable value of land and additions on the property. | Land | Improvement |
|---|---|---|---|---|
| 2025 | $6,278 | $286,180 | $40,000 | $246,180 |
| 2024 | $4,068 | $168,000 | $28,000 | $140,000 |
| 2023 | $3,579 | $168,000 | $28,000 | $140,000 |
| 2022 | $4,384 | $183,064 | $28,000 | $155,064 |
| 2021 | $3,620 | $141,620 | $28,000 | $113,620 |
| 2020 | $744 | $141,620 | $28,000 | $113,620 |
| 2019 | $740 | $109,276 | $24,000 | $85,276 |
| 2018 | $740 | $109,276 | $24,000 | $85,276 |
| 2017 | $593 | $103,928 | $24,000 | $79,928 |
| 2016 | $595 | $103,928 | $24,000 | $79,928 |
| 2015 | $525 | $79,964 | $20,044 | $59,920 |
| 2014 | $539 | $79,964 | $0 | $0 |
Source: Public Records
Map
Nearby Homes
- 4195 Antler Trail SE
- 4135 Fawn Ln SE
- 4246 Antler Trail SE
- 362 Doeskin Ln SE
- 418 Mockingbird Ln SE
- 465 Willowbrook Dr SE
- 4025 Benell Ct SE
- 3910 W Cooper Lake Dr SE
- 524 Tackett Farms Rd
- 1375 Mosswood Ln SE
- 5020 Hickory Mill Dr SE
- 203 Angla Dr SE
- 576 N Thomas Ln SE
- 3808 Concord Approach Way SE
- 317 Highview Dr SE
- 3933 N Cooper Lake Rd SE
- 0 East-West Connector Unit 11589710
- 51 Queen Anne Dr SE
- 634 Green Valley Dr SE
- 4137 Antler Trail SE
- 4116 Manson Ave SE Unit 5
- 4104 Manson Ave SE Unit 5
- 4147 Antler Trail SE Unit 3
- 4113 Manson Ave SE
- 4125 Antler Trail SE Unit 3
- 4117 Manson Ave SE Unit 5
- 4159 Antler Trail SE
- 4117 Antler Trail SE
- 4103 Manson Ave SE Unit 5
- 4120 Manson Ave SE Unit 5
- 4100 Manson Ave SE
- 4171 Antler Trail SE
- 4125 Manson Ave SE
- 4107 Antler Trail SE
- 4136 Antler Trail SE
- 4137 Winding Valley Dr SE Unit 5
- 4146 Antler Trail SE
- 4097 Manson Ave SE
- 4126 Winding Valley Dr SE Unit 5