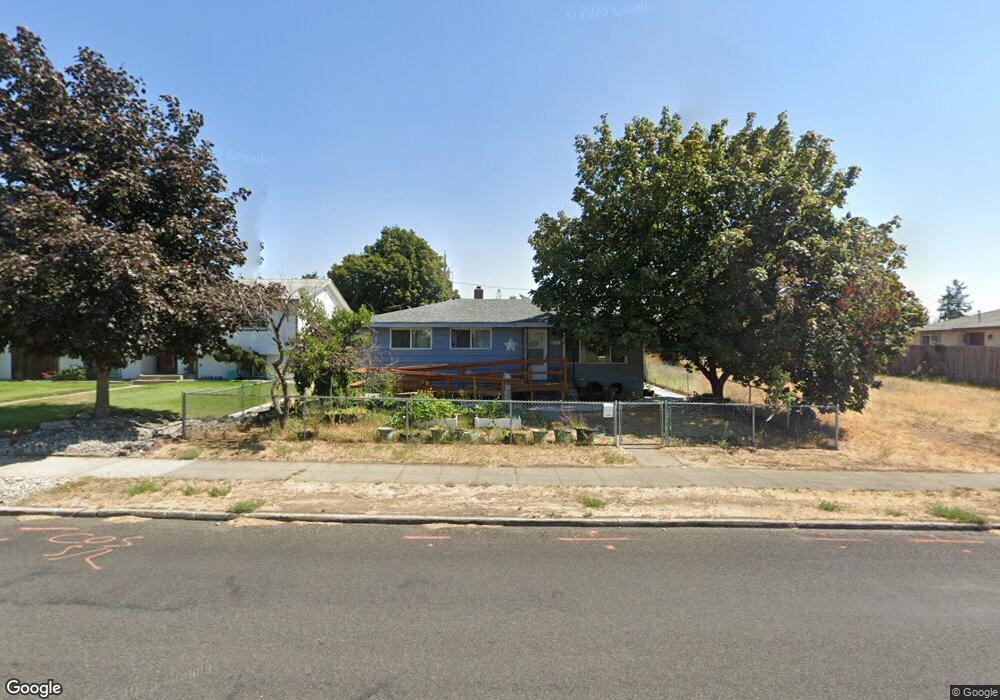
4112 N Maple St Spokane, WA 99205
North Hill NeighborhoodEstimated Value: $294,000 - $331,000
3
Beds
2
Baths
1,809
Sq Ft
$170/Sq Ft
Est. Value
About This Home
This home is located at 4112 N Maple St, Spokane, WA 99205 and is currently estimated at $307,362, approximately $169 per square foot. 4112 N Maple St is a home located in Spokane County with nearby schools including Willard Elementary School, Glover Middle School, and Shadle Park High School.
Ownership History
Date
Name
Owned For
Owner Type
Purchase Details
Closed on
Nov 13, 2009
Sold by
Deutsche Bank National Trust Company
Bought by
Nadvornick Douglas and Nadvornick Mildred
Current Estimated Value
Purchase Details
Closed on
Jul 13, 2009
Sold by
Sammons Clyde L and Sammons Dianne M
Bought by
Deutsche Bank National Trust Company and Long Beach Mortgage Loan Trust 2006-9
Purchase Details
Closed on
Apr 26, 2006
Sold by
Zaagman Bacon Lori A
Bought by
Sammons Clyde L and Sammons Dianne M
Home Financials for this Owner
Home Financials are based on the most recent Mortgage that was taken out on this home.
Original Mortgage
$126,000
Interest Rate
10.72%
Mortgage Type
Balloon
Purchase Details
Closed on
Sep 21, 1995
Sold by
Filzen Dolores I and Lerum Dolores
Bought by
Zaagman Bacon Lori A
Home Financials for this Owner
Home Financials are based on the most recent Mortgage that was taken out on this home.
Original Mortgage
$75,818
Interest Rate
7.97%
Mortgage Type
FHA
Create a Home Valuation Report for This Property
The Home Valuation Report is an in-depth analysis detailing your home's value as well as a comparison with similar homes in the area
Home Values in the Area
Average Home Value in this Area
Purchase History
| Date | Buyer | Sale Price | Title Company |
|---|---|---|---|
| Nadvornick Douglas | $80,000 | First American Title Ins Co | |
| Deutsche Bank National Trust Company | $100,300 | Spokane County Title Co | |
| Sammons Clyde L | $126,000 | Pacific Nw Title | |
| Zaagman Bacon Lori A | $76,000 | Spokane County Title |
Source: Public Records
Mortgage History
| Date | Status | Borrower | Loan Amount |
|---|---|---|---|
| Previous Owner | Sammons Clyde L | $126,000 | |
| Previous Owner | Zaagman Bacon Lori A | $75,818 |
Source: Public Records
Tax History
| Year | Tax Paid | Tax Assessment Tax Assessment Total Assessment is a certain percentage of the fair market value that is determined by local assessors to be the total taxable value of land and additions on the property. | Land | Improvement |
|---|---|---|---|---|
| 2025 | $2,648 | $278,400 | $75,000 | $203,400 |
| 2024 | $2,648 | $266,500 | $60,000 | $206,500 |
| 2023 | $2,475 | $261,500 | $55,000 | $206,500 |
| 2022 | $2,212 | $252,600 | $50,000 | $202,600 |
| 2021 | $1,863 | $156,200 | $23,000 | $133,200 |
| 2020 | $1,777 | $143,500 | $20,000 | $123,500 |
| 2019 | $1,542 | $128,700 | $20,000 | $108,700 |
| 2018 | $1,682 | $120,700 | $20,000 | $100,700 |
| 2017 | $1,622 | $118,500 | $18,000 | $100,500 |
| 2016 | $1,592 | $113,800 | $19,800 | $94,000 |
| 2015 | $1,544 | $108,000 | $19,800 | $88,200 |
| 2014 | -- | $115,700 | $19,800 | $95,900 |
| 2013 | -- | $0 | $0 | $0 |
Source: Public Records
Map
Nearby Homes
- 4014 N Maple St
- 3922 N Maple St
- 4224 N Walnut St
- 3928 N Cedar St
- 4302 N Cedar St
- 4104 N Elm St
- 1604 W Kiernan Ave
- 1808 W Kiernan Ave
- 5826 N Madison St
- 1918 W Kiernan Ave
- 4616 N Hawthorne St
- 1503 W Glass Ave
- 4722 N Walnut St
- 4811 N Maple St
- 4605 N Madison St
- 4707 N Jefferson St
- 4811 N Oak St
- 4424 N Monroe St
- 1229 W Courtland Ave
- 1426 W Cora Ct Unit 2
- 4118 N Maple St
- 4108 N Maple St
- 4124 N Maple St
- 4102 N Maple St
- 1520 W Lacrosse Ave
- 4128 N Maple St
- 4115 N Walnut St
- 4117 N Walnut St
- 4107 N Walnut St
- 4123 N Walnut St
- 4103 N Walnut St
- 4028 N Maple St
- 4127 N Walnut St
- 4125 N Maple St
- 4204 N Maple St
- 4024 N Maple St
- 4027 N Walnut St
- 4027 N Maple St
- 1506 W Rockwell Ave
- 4023 N Walnut St
Your Personal Tour Guide
Ask me questions while you tour the home.