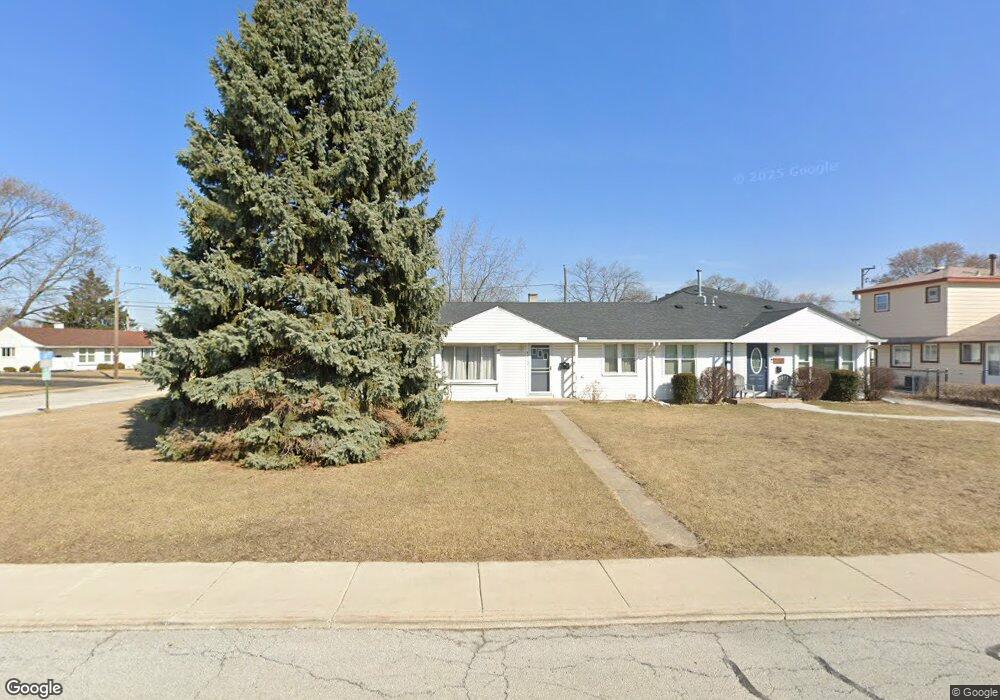
4112 W 89th Place Hometown, IL 60456
Estimated Value: $187,106 - $203,000
2
Beds
1
Bath
744
Sq Ft
$264/Sq Ft
Est. Value
About This Home
This home is located at 4112 W 89th Place, Hometown, IL 60456 and is currently estimated at $196,277, approximately $263 per square foot. 4112 W 89th Place is a home located in Cook County with nearby schools including Hometown Elementary School, J Covington Elementary School, and Sward Elementary School.
Ownership History
Date
Name
Owned For
Owner Type
Purchase Details
Closed on
Aug 27, 2004
Sold by
Oflaherty Peter
Bought by
Ehmen Lorie A
Current Estimated Value
Home Financials for this Owner
Home Financials are based on the most recent Mortgage that was taken out on this home.
Original Mortgage
$112,800
Outstanding Balance
$56,777
Interest Rate
6.12%
Mortgage Type
Unknown
Estimated Equity
$139,500
Purchase Details
Closed on
Feb 4, 2004
Sold by
Huber Rudy
Bought by
Oflaherty Peter
Home Financials for this Owner
Home Financials are based on the most recent Mortgage that was taken out on this home.
Original Mortgage
$100,000
Interest Rate
4%
Mortgage Type
Unknown
Purchase Details
Closed on
Oct 27, 1998
Sold by
Gingras Mary Louise
Bought by
Huber Rudy
Home Financials for this Owner
Home Financials are based on the most recent Mortgage that was taken out on this home.
Original Mortgage
$44,950
Interest Rate
6.83%
Create a Home Valuation Report for This Property
The Home Valuation Report is an in-depth analysis detailing your home's value as well as a comparison with similar homes in the area
Home Values in the Area
Average Home Value in this Area
Purchase History
| Date | Buyer | Sale Price | Title Company |
|---|---|---|---|
| Ehmen Lorie A | $141,000 | Pntn | |
| Oflaherty Peter | $89,000 | First American Title Ins Co | |
| Huber Rudy | $90,000 | -- |
Source: Public Records
Mortgage History
| Date | Status | Borrower | Loan Amount |
|---|---|---|---|
| Open | Ehmen Lorie A | $112,800 | |
| Previous Owner | Oflaherty Peter | $100,000 | |
| Previous Owner | Huber Rudy | $44,950 | |
| Closed | Ehmen Lorie A | $28,200 |
Source: Public Records
Tax History Compared to Growth
Tax History
| Year | Tax Paid | Tax Assessment Tax Assessment Total Assessment is a certain percentage of the fair market value that is determined by local assessors to be the total taxable value of land and additions on the property. | Land | Improvement |
|---|---|---|---|---|
| 2024 | $3,116 | $14,000 | $3,600 | $10,400 |
| 2023 | $2,626 | $14,000 | $3,600 | $10,400 |
| 2022 | $2,626 | $10,856 | $3,150 | $7,706 |
| 2021 | $2,587 | $10,855 | $3,150 | $7,705 |
| 2020 | $2,647 | $10,855 | $3,150 | $7,705 |
| 2019 | $2,422 | $10,798 | $2,850 | $7,948 |
| 2018 | $2,319 | $10,798 | $2,850 | $7,948 |
| 2017 | $2,573 | $10,798 | $2,850 | $7,948 |
| 2016 | $2,411 | $9,334 | $2,400 | $6,934 |
| 2015 | $2,338 | $9,334 | $2,400 | $6,934 |
| 2014 | $1,700 | $9,334 | $2,400 | $6,934 |
| 2013 | $2,715 | $11,505 | $2,400 | $9,105 |
Source: Public Records
Map
Nearby Homes
- 4049 W 89th Place
- 8928 S Ryan Rd
- 4153 W 89th Place Unit 1
- 8918 S Ryan Rd
- 8912 S Ryan Rd
- 8925 S Main St
- 8925 S Komensky Ave
- 8882 S Main St
- 4133 Southwest Hwy
- 9132 S Pulaski Rd Unit 2W
- 8755 S Corcoran Rd
- 8955 S Corcoran Rd
- 9620 S Kedvale Ave Unit 201E
- 9226 S Harding Ave
- 8638 S Keeler Ave
- 4025 W 93rd Place Unit 1E
- 9221 S Avers Ave
- 3853 W 86th Place
- 4515 W 88th St
- 4421 W 87th St
- 4110 W 89th Place
- 8917 S Ryan Rd
- 4104 W 89th Place
- 4128 W 89th Place
- 4100 W 89th Place
- 8915 S Ryan Rd
- 4113 W 89th Place
- 4058 W 89th Place
- 4119 W 89th Place
- 4111 W 89th Place Unit 1
- 4130 W 89th Place
- 4121 W 89th Place
- 4105 W 89th Place
- 8926 S Ryan Rd
- 8889 S Ryan Rd
- 4127 W 89th Place
- 4127 W 89th Place Unit 4127
- 8920 S Ryan Rd
- 4056 W 89th Place
- 4101 W 89th Place