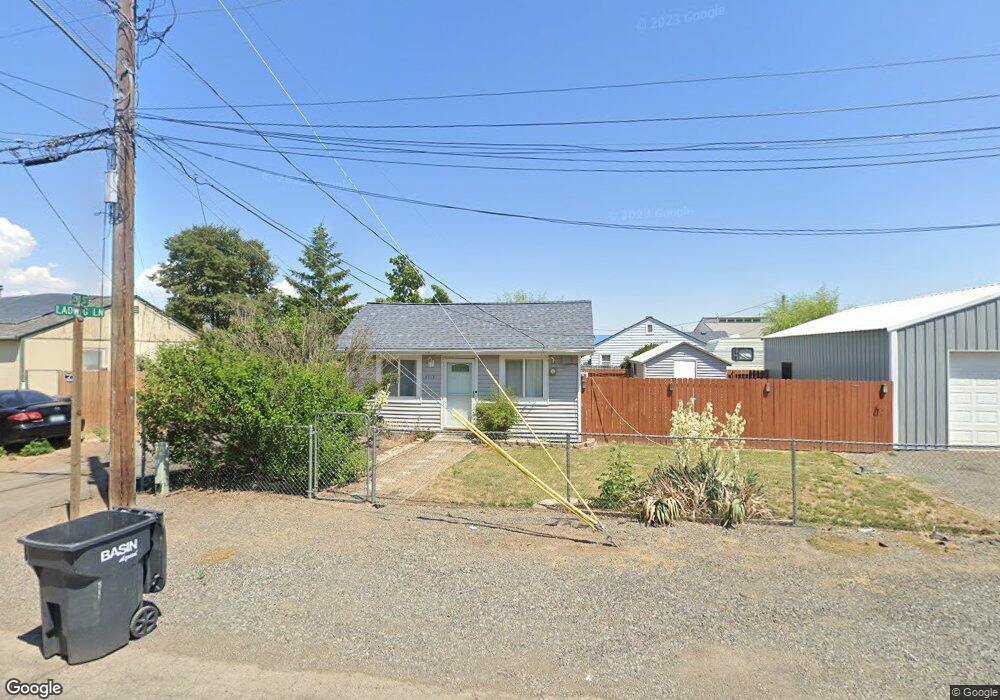
4113 2nd St Union Gap, WA 98903
Estimated Value: $132,000 - $209,462
1
Bed
1
Bath
540
Sq Ft
$345/Sq Ft
Est. Value
About This Home
This home is located at 4113 2nd St, Union Gap, WA 98903 and is currently estimated at $186,116, approximately $344 per square foot. 4113 2nd St is a home located in Yakima County with nearby schools including Union Gap School and La Salle High School.
Ownership History
Date
Name
Owned For
Owner Type
Purchase Details
Closed on
Mar 5, 2020
Sold by
Graham Sandra K and Graham Clarice D
Bought by
Sudbury Thomas and Sudbury Jennifer
Current Estimated Value
Purchase Details
Closed on
Aug 15, 2001
Sold by
Holiman Gina and Holiman Alma
Bought by
Graham David E and Graham Sandra K
Home Financials for this Owner
Home Financials are based on the most recent Mortgage that was taken out on this home.
Original Mortgage
$36,700
Interest Rate
7.21%
Purchase Details
Closed on
Dec 2, 1998
Sold by
Nelsen Clarence and Hoffman Cheryl K
Bought by
Holiman Gina and Holiman Alma
Home Financials for this Owner
Home Financials are based on the most recent Mortgage that was taken out on this home.
Original Mortgage
$29,000
Interest Rate
8%
Purchase Details
Closed on
Sep 10, 1998
Sold by
Nelsen Clarence
Bought by
Hoffman Cheryl K
Create a Home Valuation Report for This Property
The Home Valuation Report is an in-depth analysis detailing your home's value as well as a comparison with similar homes in the area
Home Values in the Area
Average Home Value in this Area
Purchase History
| Date | Buyer | Sale Price | Title Company |
|---|---|---|---|
| Sudbury Thomas | $109,037 | Schreiner Title Company | |
| Graham David E | $39,000 | First American Title Ins Co | |
| Holiman Gina | -- | Yakima Title Company | |
| Holiman Gina | $39,000 | Schreiner Title Company | |
| Hoffman Cheryl K | -- | -- |
Source: Public Records
Mortgage History
| Date | Status | Borrower | Loan Amount |
|---|---|---|---|
| Previous Owner | Graham David E | $36,700 | |
| Previous Owner | Holiman Gina | $29,000 |
Source: Public Records
Tax History Compared to Growth
Tax History
| Year | Tax Paid | Tax Assessment Tax Assessment Total Assessment is a certain percentage of the fair market value that is determined by local assessors to be the total taxable value of land and additions on the property. | Land | Improvement |
|---|---|---|---|---|
| 2025 | $1,720 | $211,500 | $29,200 | $182,300 |
| 2023 | $1,424 | $104,500 | $24,600 | $79,900 |
| 2022 | $1,013 | $98,800 | $24,600 | $74,200 |
| 2021 | $940 | $86,900 | $24,600 | $62,300 |
| 2019 | $43 | $65,800 | $24,600 | $41,200 |
| 2018 | $720 | $63,400 | $24,600 | $38,800 |
| 2017 | $682 | $63,700 | $24,600 | $39,100 |
| 2016 | $818 | $63,750 | $24,550 | $39,200 |
| 2015 | $818 | $65,050 | $24,550 | $40,500 |
| 2014 | $818 | $65,450 | $24,550 | $40,900 |
| 2013 | $818 | $65,450 | $24,550 | $40,900 |
Source: Public Records
Map
Nearby Homes
- 4207 Main St
- 308 W California St
- 8 E Washington St
- 103 Spring Ave
- 102 E California St Unit 6
- 12 Leisure Hill Dr
- 6 Leisure Hill Dr Unit 13
- 61 Leisure Hill Dr
- 27 Leisure Hill Dr
- 24 Leisure Hill Dr Unit 24
- 26 Leisure Hill Dr
- 403 W Ahtanum Rd
- 3431 Goodman Rd
- 207 W Oak St
- 500 Richards Rd
- 0 Goodman Rd
- 2007 Longfibre Rd
- 2802 S 5th Ave Unit 31
- 2802 S 5th Ave Unit 30
- 2802 S 5th Ave Unit 17