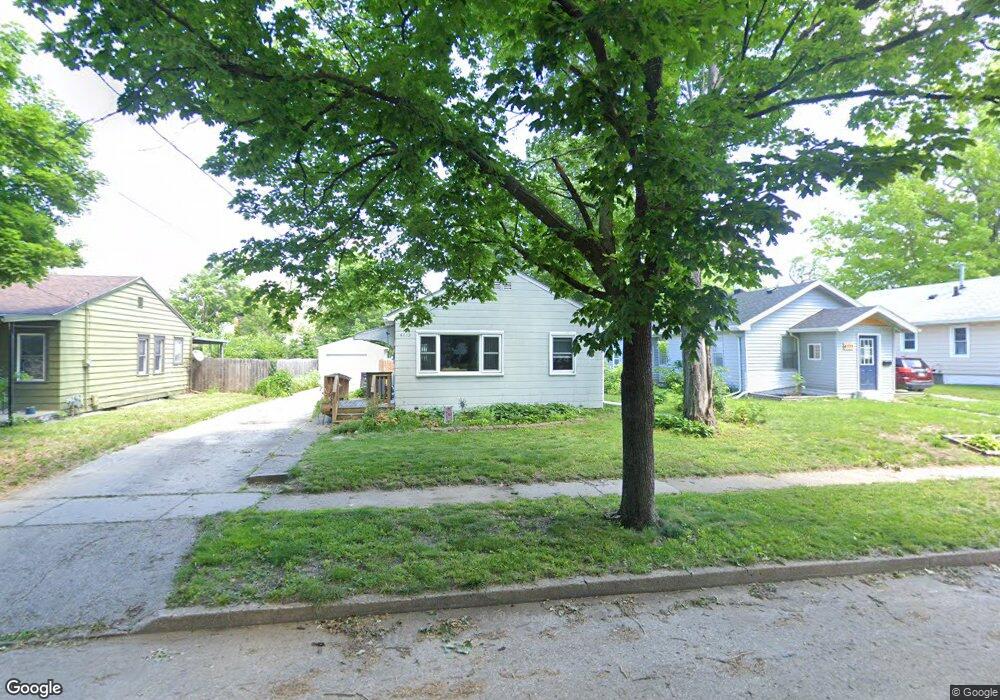
4113 3rd St Des Moines, IA 50313
Highland Park NeighborhoodEstimated Value: $122,000 - $164,000
2
Beds
1
Bath
808
Sq Ft
$178/Sq Ft
Est. Value
About This Home
This home is located at 4113 3rd St, Des Moines, IA 50313 and is currently estimated at $143,579, approximately $177 per square foot. 4113 3rd St is a home located in Polk County with nearby schools including Oak Park Elementary School, Harding Middle School, and North High School.
Ownership History
Date
Name
Owned For
Owner Type
Purchase Details
Closed on
May 7, 2025
Sold by
Julia R Prochnow Revocable Trust and Prochnow Julia R
Bought by
Julia R Prochnow Revocable Trust and Prochnow
Current Estimated Value
Purchase Details
Closed on
Jun 17, 2022
Sold by
Prochnow Julia R
Bought by
Julia R Prochnow Revocable Trust
Purchase Details
Closed on
Aug 30, 2017
Sold by
Kohles Development Llc
Bought by
Jj Homes Llc
Purchase Details
Closed on
Jul 11, 2017
Sold by
Federal National Mortgage Assosiation
Bought by
Kohles Development Llc
Purchase Details
Closed on
Mar 25, 2015
Sold by
Gogerty David S and Heffernen Jessica R
Bought by
Niichel Justin
Home Financials for this Owner
Home Financials are based on the most recent Mortgage that was taken out on this home.
Original Mortgage
$135,000
Interest Rate
3.73%
Mortgage Type
VA
Create a Home Valuation Report for This Property
The Home Valuation Report is an in-depth analysis detailing your home's value as well as a comparison with similar homes in the area
Home Values in the Area
Average Home Value in this Area
Purchase History
| Date | Buyer | Sale Price | Title Company |
|---|---|---|---|
| Julia R Prochnow Revocable Trust | -- | None Listed On Document | |
| Julia R Prochnow Revocable Trust | -- | None Listed On Document | |
| Julia R Prochnow Revocable Trust | -- | None Listed On Document | |
| Jj Homes Llc | -- | None Available | |
| Kohles Development Llc | $126,000 | None Available | |
| Niichel Justin | $148,000 | None Available |
Source: Public Records
Mortgage History
| Date | Status | Borrower | Loan Amount |
|---|---|---|---|
| Previous Owner | Niichel Justin | $135,000 |
Source: Public Records
Tax History
| Year | Tax Paid | Tax Assessment Tax Assessment Total Assessment is a certain percentage of the fair market value that is determined by local assessors to be the total taxable value of land and additions on the property. | Land | Improvement |
|---|---|---|---|---|
| 2025 | $1,986 | $128,500 | $28,800 | $99,700 |
| 2024 | $1,986 | $111,400 | $25,000 | $86,400 |
| 2023 | $1,984 | $111,400 | $25,000 | $86,400 |
| 2022 | $1,968 | $93,100 | $21,700 | $71,400 |
| 2021 | $1,800 | $93,100 | $21,700 | $71,400 |
| 2020 | $1,864 | $80,700 | $18,900 | $61,800 |
| 2019 | $1,690 | $80,700 | $18,900 | $61,800 |
| 2018 | $1,668 | $71,400 | $16,400 | $55,000 |
| 2017 | $1,520 | $71,400 | $16,400 | $55,000 |
| 2016 | $1,476 | $64,700 | $14,800 | $49,900 |
| 2015 | $1,476 | $64,700 | $14,800 | $49,900 |
| 2014 | $1,484 | $66,900 | $15,000 | $51,900 |
Source: Public Records
Map
Nearby Homes
Your Personal Tour Guide
Ask me questions while you tour the home.