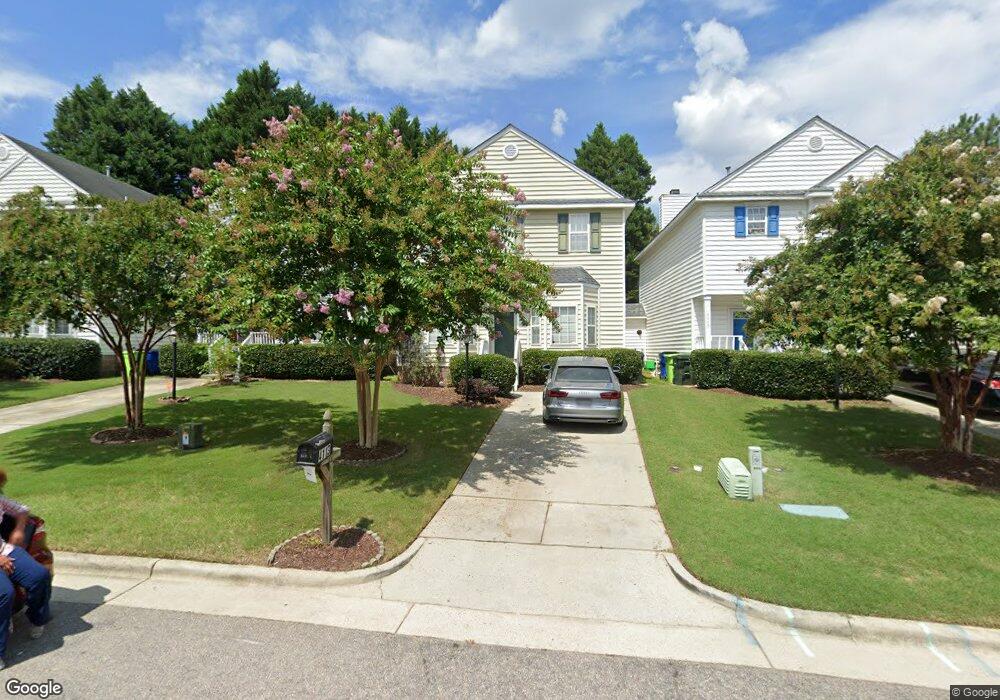
4113 Beaufain St Raleigh, NC 27604
Northeast Raleigh NeighborhoodEstimated Value: $268,000 - $299,000
4
Beds
3
Baths
1,710
Sq Ft
$168/Sq Ft
Est. Value
About This Home
This home is located at 4113 Beaufain St, Raleigh, NC 27604 and is currently estimated at $286,697, approximately $167 per square foot. 4113 Beaufain St is a home located in Wake County with nearby schools including River Bend Elementary, River Bend Middle, and Rolesville High School.
Ownership History
Date
Name
Owned For
Owner Type
Purchase Details
Closed on
Jun 12, 2018
Sold by
Matthew C Phillips
Bought by
Odom Alexis
Current Estimated Value
Home Financials for this Owner
Home Financials are based on the most recent Mortgage that was taken out on this home.
Original Mortgage
$168,780
Outstanding Balance
$146,098
Interest Rate
4.54%
Estimated Equity
$140,599
Purchase Details
Closed on
Sep 12, 2017
Sold by
Kornegay Emily and Tharpe Emily
Bought by
Phillips Matthew C and 4113 Beaufain St Trust
Purchase Details
Closed on
Jul 28, 2006
Sold by
Mullins Melvin H
Bought by
Tharpe Emily
Home Financials for this Owner
Home Financials are based on the most recent Mortgage that was taken out on this home.
Original Mortgage
$108,800
Interest Rate
9.65%
Mortgage Type
Balloon
Create a Home Valuation Report for This Property
The Home Valuation Report is an in-depth analysis detailing your home's value as well as a comparison with similar homes in the area
Home Values in the Area
Average Home Value in this Area
Purchase History
| Date | Buyer | Sale Price | Title Company |
|---|---|---|---|
| Odom Alexis | -- | -- | |
| Phillips Matthew C | $128,000 | None Available | |
| Tharpe Emily | $136,000 | None Available |
Source: Public Records
Mortgage History
| Date | Status | Borrower | Loan Amount |
|---|---|---|---|
| Open | Odom Alexis | $168,780 | |
| Closed | Odom Alexis | -- | |
| Previous Owner | Tharpe Emily | $108,800 | |
| Previous Owner | Tharpe Emily | $27,200 | |
| Previous Owner | Odom Alexis | $25,000 |
Source: Public Records
Tax History
| Year | Tax Paid | Tax Assessment Tax Assessment Total Assessment is a certain percentage of the fair market value that is determined by local assessors to be the total taxable value of land and additions on the property. | Land | Improvement |
|---|---|---|---|---|
| 2025 | $2,706 | $307,999 | $75,000 | $232,999 |
| 2024 | $2,695 | $307,999 | $75,000 | $232,999 |
Source: Public Records
Map
Nearby Homes
- 4650 Vendue Range Dr
- 4010 Charleston Park Dr
- 4004 Beaufain St
- 4612 Thorn Leaf Ct
- 4614 Clove Meadow Ct
- 4223 Jane Ln
- 3712 Old Coach Rd
- 3748 Charleston Park Dr
- 3600 Top of the Pines Ct
- 4109 Stonewall Dr
- 4809 Arbor Chase Dr
- 4225 Fowler Ridge Dr
- 4737 Waterford Cove Dr
- 4522 Centrebrook Cir
- 4000 Donna Rd
- 4721 Mocha Ln
- 4809 Kaycee Ct
- 4701 Tommans Trail
- 4249 Saubranch Hill St
- 4416 Brintons Cottage St
- 4111 Beaufain St
- 4115 Beaufain St
- 4117 Beaufain St
- 4109 Beaufain St
- 4119 Beaufain St
- 4112 Beaufain St
- 4110 Beaufain St
- 4121 Beaufain St
- 4114 Beaufain St
- 4108 Beaufain St
- 4120 Beaufain St
- 4123 Beaufain St
- 4122 Beaufain St
- 4104 Beaufain St
- 4125 Beaufain St
- 4500 Buffaloe Rd
- 4511 Pinckney Place
- 4124 Beaufain St
- 4102 Beaufain St
- 4509 Pinckney Place
Your Personal Tour Guide
Ask me questions while you tour the home.