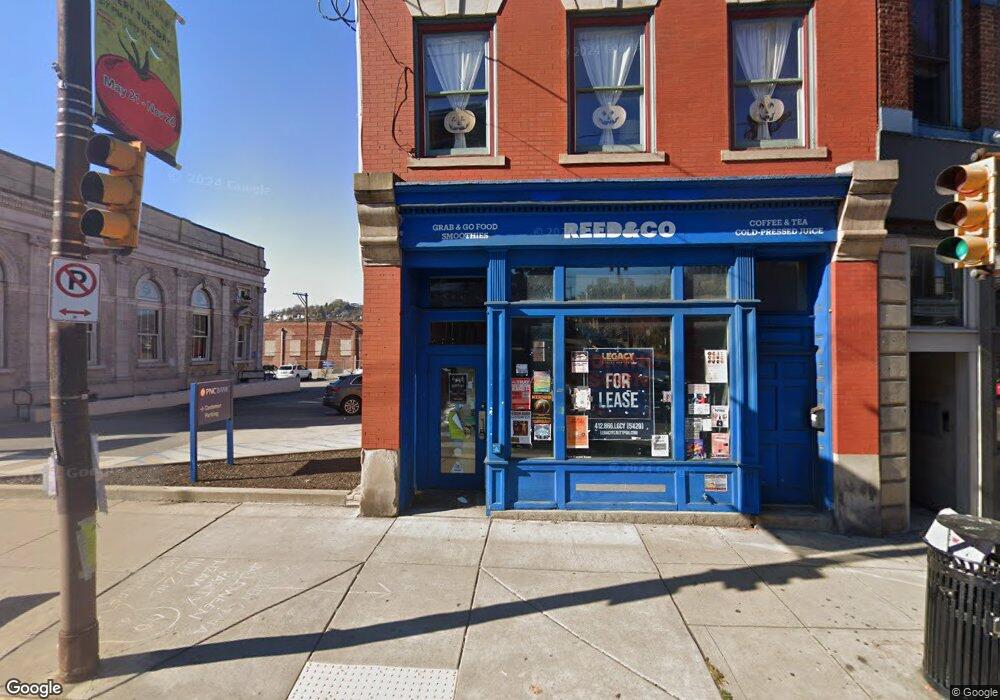
4113 Butler St Pittsburgh, PA 15201
Central Lawrenceville Neighborhood
--
Bed
--
Bath
--
Sq Ft
3,049
Sq Ft Lot
About This Home
This home is located at 4113 Butler St, Pittsburgh, PA 15201. 4113 Butler St is a home located in Allegheny County with nearby schools including Pittsburgh Arsenal 6-8, Pittsburgh Arsenal K-5, and Pittsburgh Milliones 6-12.
Ownership History
Date
Name
Owned For
Owner Type
Purchase Details
Closed on
Jul 22, 2025
Sold by
Lawrenceville Holdings L L C and Lawrenceville Holdings Vi L P
Bought by
Z F R A L L C and Zfra L L C
Home Financials for this Owner
Home Financials are based on the most recent Mortgage that was taken out on this home.
Original Mortgage
$540,000
Outstanding Balance
$539,084
Interest Rate
6.84%
Mortgage Type
New Conventional
Purchase Details
Closed on
Jun 2, 2003
Sold by
Pittsburgh Factors Co
Bought by
Hendrickson Harry L
Create a Home Valuation Report for This Property
The Home Valuation Report is an in-depth analysis detailing your home's value as well as a comparison with similar homes in the area
Home Values in the Area
Average Home Value in this Area
Purchase History
| Date | Buyer | Sale Price | Title Company |
|---|---|---|---|
| Z F R A L L C | $850,000 | -- | |
| Z F R A L L C | $850,000 | -- | |
| Hendrickson Harry L | $239,340 | -- |
Source: Public Records
Mortgage History
| Date | Status | Borrower | Loan Amount |
|---|---|---|---|
| Open | Z F R A L L C | $540,000 | |
| Closed | Z F R A L L C | $540,000 |
Source: Public Records
Tax History Compared to Growth
Tax History
| Year | Tax Paid | Tax Assessment Tax Assessment Total Assessment is a certain percentage of the fair market value that is determined by local assessors to be the total taxable value of land and additions on the property. | Land | Improvement |
|---|---|---|---|---|
| 2025 | $4,196 | $182,100 | $66,600 | $115,500 |
| 2024 | $4,196 | $182,100 | $66,600 | $115,500 |
| 2023 | $4,196 | $182,100 | $66,600 | $115,500 |
| 2022 | $4,141 | $182,100 | $66,600 | $115,500 |
| 2021 | $4,186 | $182,100 | $66,600 | $115,500 |
| 2020 | $4,121 | $182,100 | $66,600 | $115,500 |
| 2019 | $4,121 | $182,100 | $66,600 | $115,500 |
| 2018 | $3,305 | $182,100 | $66,600 | $115,500 |
| 2017 | $4,121 | $182,100 | $66,600 | $115,500 |
| 2016 | $861 | $182,100 | $66,600 | $115,500 |
| 2015 | $861 | $182,100 | $66,600 | $115,500 |
| 2014 | $4,030 | $182,100 | $66,600 | $115,500 |
Source: Public Records
Map
Nearby Homes