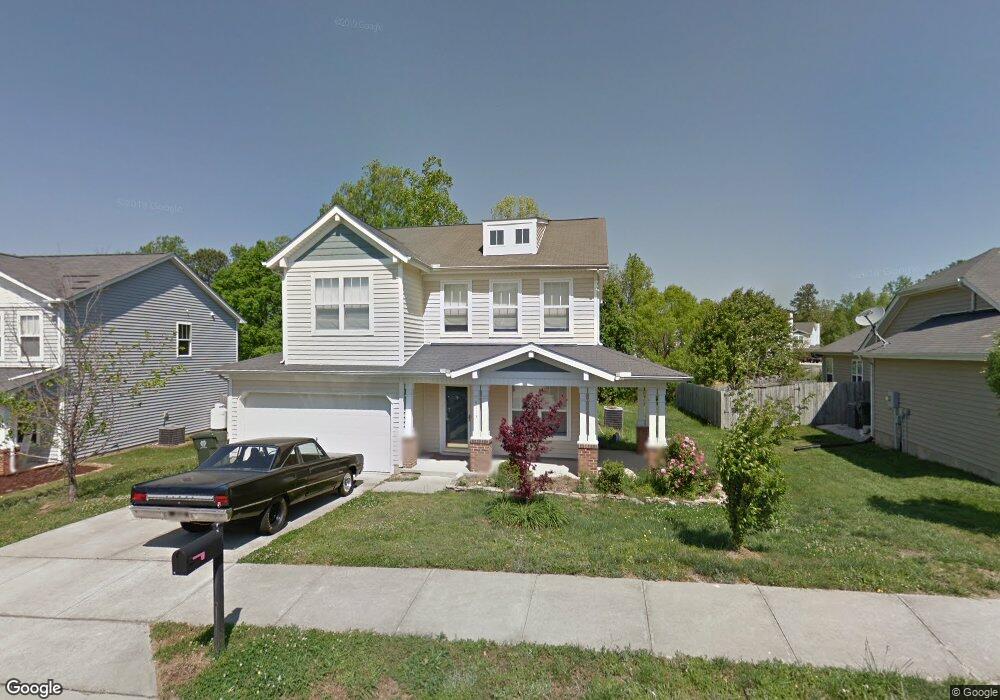
4113 Hopper St Raleigh, NC 27616
Forestville NeighborhoodEstimated Value: $364,000 - $383,000
3
Beds
3
Baths
1,820
Sq Ft
$205/Sq Ft
Est. Value
About This Home
This home is located at 4113 Hopper St, Raleigh, NC 27616 and is currently estimated at $373,098, approximately $204 per square foot. 4113 Hopper St is a home located in Wake County with nearby schools including Harris Creek Elementary School, Rolesville Middle School, and Rolesville High School.
Ownership History
Date
Name
Owned For
Owner Type
Purchase Details
Closed on
Nov 18, 2015
Sold by
Secretary Of Hud
Bought by
Newry Elyse
Current Estimated Value
Home Financials for this Owner
Home Financials are based on the most recent Mortgage that was taken out on this home.
Original Mortgage
$137,000
Outstanding Balance
$107,720
Interest Rate
3.78%
Mortgage Type
New Conventional
Estimated Equity
$265,378
Purchase Details
Closed on
Jan 23, 2015
Sold by
Jpmorgan Chase Bank Na
Bought by
Secretary Of Hud
Purchase Details
Closed on
Jan 22, 2015
Sold by
Cusack John R
Bought by
Jpmorgan Chase Bank Na
Purchase Details
Closed on
May 25, 2005
Sold by
Davis Anthony M and Davis Kimberly M
Bought by
Cusack John R
Home Financials for this Owner
Home Financials are based on the most recent Mortgage that was taken out on this home.
Original Mortgage
$31,100
Interest Rate
5.74%
Mortgage Type
Stand Alone Second
Purchase Details
Closed on
Dec 12, 2001
Sold by
Beazer Homes Corp
Bought by
Davis Anthony M and Davis Kimberly M
Home Financials for this Owner
Home Financials are based on the most recent Mortgage that was taken out on this home.
Original Mortgage
$150,833
Interest Rate
6.5%
Mortgage Type
FHA
Create a Home Valuation Report for This Property
The Home Valuation Report is an in-depth analysis detailing your home's value as well as a comparison with similar homes in the area
Home Values in the Area
Average Home Value in this Area
Purchase History
| Date | Buyer | Sale Price | Title Company |
|---|---|---|---|
| Newry Elyse | -- | None Available | |
| Secretary Of Hud | -- | Attorney | |
| Jpmorgan Chase Bank Na | $182,632 | None Available | |
| Cusack John R | $155,500 | -- | |
| Davis Anthony M | $153,500 | -- |
Source: Public Records
Mortgage History
| Date | Status | Borrower | Loan Amount |
|---|---|---|---|
| Open | Newry Elyse | $137,000 | |
| Previous Owner | Cusack John R | $31,100 | |
| Previous Owner | Cusack John R | $124,400 | |
| Previous Owner | Davis Anthony M | $150,833 |
Source: Public Records
Tax History
| Year | Tax Paid | Tax Assessment Tax Assessment Total Assessment is a certain percentage of the fair market value that is determined by local assessors to be the total taxable value of land and additions on the property. | Land | Improvement |
|---|---|---|---|---|
| 2025 | $3,171 | $361,268 | $100,000 | $261,268 |
| 2024 | $3,158 | $361,268 | $100,000 | $261,268 |
Source: Public Records
Map
Nearby Homes
- 3626 Jordan Mill Ct
- 3509 Pinkham Way
- 3617 Culater Ct
- 3400 Kensett Way
- 4104 Lodge Allen Ct
- 4116 Lodge Allen Ct
- 8005 Caliber Woods Dr
- 7320 Brighton Village Dr
- 3624 Iron Sight Ct
- 3605 Iron Sight Ct
- 3421 Tunas St
- Sherwood Plan at Watkins Glen
- Johnson Plan at Watkins Glen
- Chatham Plan at Watkins Glen
- Taylorsville Plan at Watkins Glen
- 4028 Wesley Chapel Way
- 3236 Forest Mill Cir
- 3904 Leeson Trail
- 3517 Telluride Trail
- 8233 Marshall Brae Dr
- 4109 Hopper St
- 4117 Hopper St
- 4105 Hopper St
- 4121 Hopper St
- 3322 Deering Dr
- 3400 Deering Dr
- 3328 Deering Dr
- 3316 Deering Dr
- 4112 Hopper St
- 3500 Deering Dr
- 4101 Hopper St
- 4108 Hopper St
- 3501 Hamilton Mill Dr
- 4201 Hopper St
- 4009 Hopper St
- 3308 Deering Dr
- 4109 Littleton Dr
- 3508 Deering Dr
- 4200 Hopper St
- 3505 Hamilton Mill Dr