41135 Summit Place Palmdale, CA 93551
West Palmdale NeighborhoodEstimated Value: $648,000 - $750,000
5
Beds
3
Baths
2,626
Sq Ft
$262/Sq Ft
Est. Value
About This Home
This home is located at 41135 Summit Place, Palmdale, CA 93551 and is currently estimated at $688,151, approximately $262 per square foot. 41135 Summit Place is a home located in Los Angeles County with nearby schools including Rancho Vista Elementary School, Hillview Middle, and Quartz Hill High School.
Ownership History
Date
Name
Owned For
Owner Type
Purchase Details
Closed on
Jul 11, 1997
Sold by
First Mtg Corp
Bought by
Federal National Mortgage Association
Current Estimated Value
Home Financials for this Owner
Home Financials are based on the most recent Mortgage that was taken out on this home.
Original Mortgage
$153,250
Outstanding Balance
$21,647
Interest Rate
7.83%
Mortgage Type
Seller Take Back
Estimated Equity
$666,504
Purchase Details
Closed on
Jun 16, 1997
Sold by
Federal National Mortgage Association
Bought by
Blanchard John Fitzgerald and Blanchard Melissa Joy
Home Financials for this Owner
Home Financials are based on the most recent Mortgage that was taken out on this home.
Original Mortgage
$153,250
Outstanding Balance
$21,647
Interest Rate
7.83%
Mortgage Type
Seller Take Back
Estimated Equity
$666,504
Purchase Details
Closed on
Mar 25, 1997
Sold by
Gill Gurdarshan
Bought by
First Mtg Corp
Create a Home Valuation Report for This Property
The Home Valuation Report is an in-depth analysis detailing your home's value as well as a comparison with similar homes in the area
Home Values in the Area
Average Home Value in this Area
Purchase History
| Date | Buyer | Sale Price | Title Company |
|---|---|---|---|
| Federal National Mortgage Association | -- | -- | |
| Blanchard John Fitzgerald | $158,000 | -- | |
| First Mtg Corp | $144,000 | United Title Company |
Source: Public Records
Mortgage History
| Date | Status | Borrower | Loan Amount |
|---|---|---|---|
| Open | Blanchard John Fitzgerald | $153,250 |
Source: Public Records
Tax History
| Year | Tax Paid | Tax Assessment Tax Assessment Total Assessment is a certain percentage of the fair market value that is determined by local assessors to be the total taxable value of land and additions on the property. | Land | Improvement |
|---|---|---|---|---|
| 2025 | $3,892 | $252,258 | $50,443 | $201,815 |
| 2024 | $3,892 | $247,312 | $49,454 | $197,858 |
| 2023 | $3,858 | $242,464 | $48,485 | $193,979 |
| 2022 | $3,795 | $237,711 | $47,535 | $190,176 |
| 2021 | $3,734 | $233,051 | $46,603 | $186,448 |
| 2019 | $3,640 | $226,141 | $45,222 | $180,919 |
| 2018 | $3,578 | $221,708 | $44,336 | $177,372 |
| 2017 | $3,521 | $217,362 | $43,467 | $173,895 |
| 2016 | $3,380 | $213,101 | $42,615 | $170,486 |
| 2015 | $3,340 | $209,901 | $41,975 | $167,926 |
| 2014 | $3,333 | $205,790 | $41,153 | $164,637 |
Source: Public Records
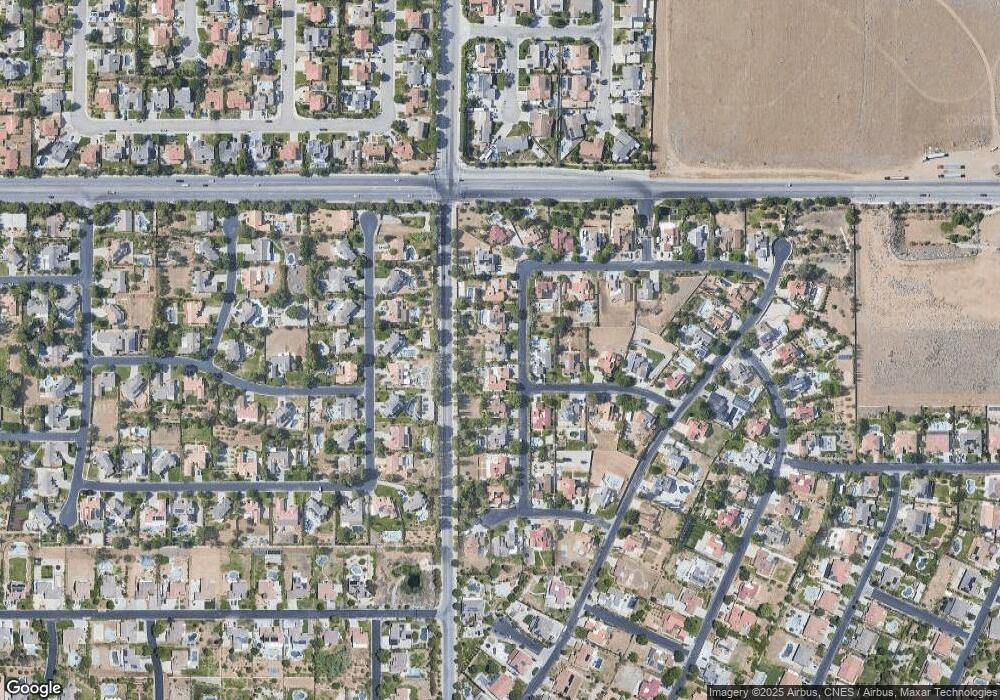
Map
Nearby Homes
- 41060 Oakview Ln
- 41233 Almond Ave
- 5133 Hillside Place
- 41154 Heights Dr
- 90 Avenue N-8
- 41423 Vista Linda
- 41164 Carmel Rd
- 40908 Rise Ct
- 5355 Palais Place
- 0 Alleppo
- 41231 Crispi Ln
- 5101 Meadowsweet Dr
- 41004 Via Tranqilo
- 0 Vic Avenue N 50th Stw Unit 25006079
- 41301 Elsdale Place
- 41530 Nonpareil Dr
- 5200 Entrar Dr Unit 174
- 41509 51st St W
- 40701 Rancho Vista Blvd Unit 43
- 40701 Rancho Vista Blvd Unit Spc 353
- 41147 Summit Place
- 41127 Summit Place
- 5339 Gardendale Ln
- 41155 Summit Place
- 41115 Summit Place
- 5334 Northridge Dr
- 5327 Gardendale Ln
- 41140 Summitview Ln
- 41107 Summit Place
- 41130 Summitview Ln
- 41163 Summit Place
- 41150 Summitview Ln
- 5320 Northridge Dr
- 41118 Summitview Ln
- 5328 Gardendale Ln
- 41160 Summitview Ln
- 5319 Gardendale Ln
- 41059 Summit Place
- 5343 Northridge Dr
- 5337 Northridge Dr
Your Personal Tour Guide
Ask me questions while you tour the home.