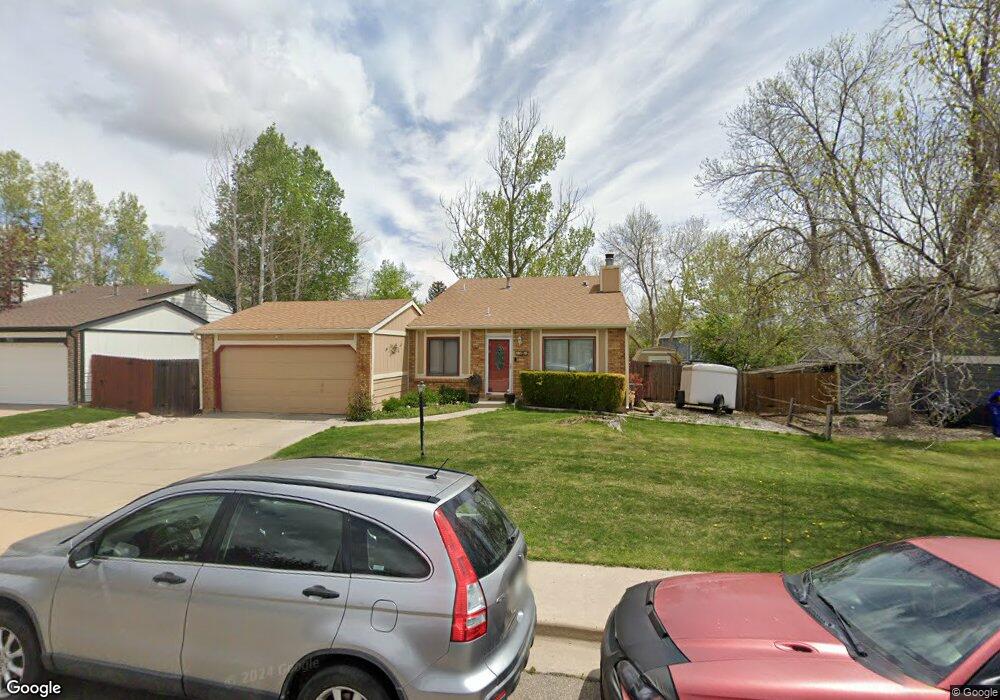
4114 Balsa Ct Loveland, CO 80538
Estimated Value: $437,404 - $462,000
3
Beds
2
Baths
1,404
Sq Ft
$318/Sq Ft
Est. Value
About This Home
This home is located at 4114 Balsa Ct, Loveland, CO 80538 and is currently estimated at $446,351, approximately $317 per square foot. 4114 Balsa Ct is a home located in Larimer County with nearby schools including Lincoln Elementary School, Lucile Erwin Middle School, and Loveland High School.
Ownership History
Date
Name
Owned For
Owner Type
Purchase Details
Closed on
Jul 31, 2002
Sold by
Fairbairn Robert F and Fairbairn Joleen A
Bought by
Sanchez Hugo and Sanchez Guadalupe
Current Estimated Value
Home Financials for this Owner
Home Financials are based on the most recent Mortgage that was taken out on this home.
Original Mortgage
$171,576
Outstanding Balance
$72,966
Interest Rate
6.62%
Mortgage Type
FHA
Estimated Equity
$373,385
Purchase Details
Closed on
Sep 21, 2001
Sold by
Fairbairn Robert F and Werner Joleen A
Bought by
Fairbairn Robert F and Fairbairn Joleen A
Home Financials for this Owner
Home Financials are based on the most recent Mortgage that was taken out on this home.
Original Mortgage
$107,500
Interest Rate
6.44%
Purchase Details
Closed on
Aug 1, 1995
Sold by
Stewart Andrea G
Bought by
Werner Joleen A
Purchase Details
Closed on
Jul 1, 1994
Sold by
Rieke Myra
Bought by
Stewart Andrea G
Create a Home Valuation Report for This Property
The Home Valuation Report is an in-depth analysis detailing your home's value as well as a comparison with similar homes in the area
Home Values in the Area
Average Home Value in this Area
Purchase History
| Date | Buyer | Sale Price | Title Company |
|---|---|---|---|
| Sanchez Hugo | $174,000 | -- | |
| Fairbairn Robert F | -- | Land Title Guarantee Company | |
| Werner Joleen A | $112,000 | -- | |
| Stewart Andrea G | $104,000 | -- |
Source: Public Records
Mortgage History
| Date | Status | Borrower | Loan Amount |
|---|---|---|---|
| Open | Sanchez Hugo | $171,576 | |
| Previous Owner | Fairbairn Robert F | $107,500 |
Source: Public Records
Tax History Compared to Growth
Tax History
| Year | Tax Paid | Tax Assessment Tax Assessment Total Assessment is a certain percentage of the fair market value that is determined by local assessors to be the total taxable value of land and additions on the property. | Land | Improvement |
|---|---|---|---|---|
| 2025 | $2,035 | $29,185 | $3,350 | $25,835 |
| 2024 | $1,963 | $29,185 | $3,350 | $25,835 |
| 2022 | $1,723 | $21,649 | $3,475 | $18,174 |
| 2021 | $1,770 | $22,272 | $3,575 | $18,697 |
| 2020 | $1,662 | $20,899 | $3,575 | $17,324 |
| 2019 | $1,634 | $20,899 | $3,575 | $17,324 |
| 2018 | $1,452 | $17,640 | $3,600 | $14,040 |
| 2017 | $1,250 | $17,640 | $3,600 | $14,040 |
| 2016 | $1,113 | $15,180 | $3,980 | $11,200 |
| 2015 | $1,104 | $15,180 | $3,980 | $11,200 |
| 2014 | $944 | $12,560 | $3,980 | $8,580 |
Source: Public Records
Map
Nearby Homes
- 4150 Ebony Ct
- 4056 Boxelder Dr
- 4403 Shubert Dr
- 4406 Chateau Dr
- 1221 Bay Ct
- 1532 Oak Creek Dr
- 1266 W 45th St
- 1555 Oak Creek Dr
- 4019 Burr Oak Dr
- 3621 Adena Ct
- 980 Norway Maple Dr
- 4715 Wisconsin Ave
- 717 W 36th St
- 975 Norway Maple Dr
- 3750 Sheridan Ave
- 1463 Caddoa Dr
- 2070 Tonopas Ct
- 1475 Massadona Place
- 3638 Butternut Dr Unit 7A
- 1734 W 50th St