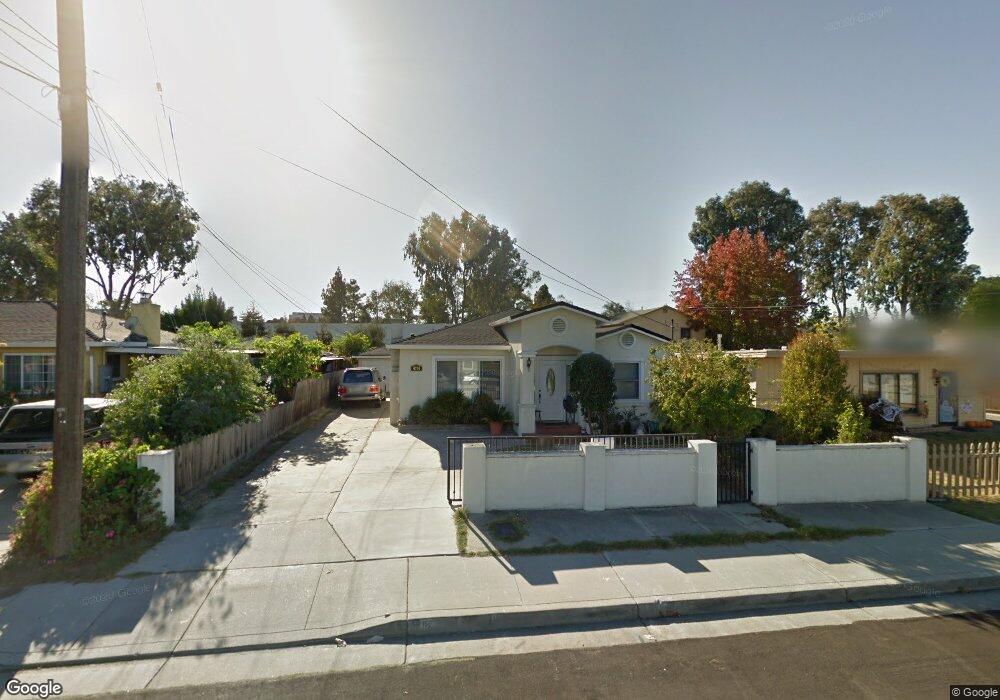
4114 Cheeney St Santa Clara, CA 95054
North Santa Clara NeighborhoodEstimated Value: $1,114,000 - $1,440,154
2
Beds
1
Bath
1,072
Sq Ft
$1,210/Sq Ft
Est. Value
About This Home
This home is located at 4114 Cheeney St, Santa Clara, CA 95054 and is currently estimated at $1,297,539, approximately $1,210 per square foot. 4114 Cheeney St is a home located in Santa Clara County with nearby schools including Kathryn Hughes Elementary School, Buchser Middle School, and Santa Clara High School.
Ownership History
Date
Name
Owned For
Owner Type
Purchase Details
Closed on
Nov 30, 2007
Sold by
Peralta Melanio T and Peralta Pauline L
Bought by
Peralta Pauline L and Peralta Melanio T
Current Estimated Value
Home Financials for this Owner
Home Financials are based on the most recent Mortgage that was taken out on this home.
Original Mortgage
$536,000
Outstanding Balance
$335,209
Interest Rate
6.07%
Mortgage Type
New Conventional
Estimated Equity
$962,330
Purchase Details
Closed on
Dec 22, 2005
Sold by
Peralta Melanio and Peralta Pauline
Bought by
Peralta Melanio T and Peralta Pauline L
Home Financials for this Owner
Home Financials are based on the most recent Mortgage that was taken out on this home.
Original Mortgage
$468,000
Interest Rate
6.36%
Mortgage Type
New Conventional
Purchase Details
Closed on
May 3, 2000
Sold by
Clemons James A And Jeanine Trustee
Bought by
Peralta Melanio and Peralta Pauline
Home Financials for this Owner
Home Financials are based on the most recent Mortgage that was taken out on this home.
Original Mortgage
$269,000
Interest Rate
4.4%
Purchase Details
Closed on
Jul 10, 1997
Sold by
Clemons James A
Bought by
Clemons James A and Clemons Jeanine
Purchase Details
Closed on
Jan 8, 1993
Sold by
Locke Thomas Y and Locke Mae C
Bought by
Clemons James A and Clemons Jeanine
Create a Home Valuation Report for This Property
The Home Valuation Report is an in-depth analysis detailing your home's value as well as a comparison with similar homes in the area
Home Values in the Area
Average Home Value in this Area
Purchase History
| Date | Buyer | Sale Price | Title Company |
|---|---|---|---|
| Peralta Pauline L | -- | First American Title Company | |
| Peralta Melanio T | -- | Fidelity National Title Ins | |
| Peralta Melanio | $359,000 | Fidelity National Title Co | |
| Clemons James A | -- | -- | |
| Clemons James A | -- | -- |
Source: Public Records
Mortgage History
| Date | Status | Borrower | Loan Amount |
|---|---|---|---|
| Open | Peralta Pauline L | $536,000 | |
| Closed | Peralta Melanio T | $468,000 | |
| Closed | Peralta Melanio | $269,000 |
Source: Public Records
Tax History Compared to Growth
Tax History
| Year | Tax Paid | Tax Assessment Tax Assessment Total Assessment is a certain percentage of the fair market value that is determined by local assessors to be the total taxable value of land and additions on the property. | Land | Improvement |
|---|---|---|---|---|
| 2025 | $6,488 | $557,160 | $220,545 | $336,615 |
| 2024 | $6,488 | $546,236 | $216,221 | $330,015 |
| 2023 | $6,423 | $535,527 | $211,982 | $323,545 |
| 2022 | $6,318 | $525,027 | $207,826 | $317,201 |
| 2021 | $6,292 | $514,733 | $203,751 | $310,982 |
| 2020 | $6,178 | $509,456 | $201,662 | $307,794 |
| 2019 | $6,171 | $499,467 | $197,708 | $301,759 |
| 2018 | $5,777 | $489,675 | $193,832 | $295,843 |
| 2017 | $5,748 | $480,075 | $190,032 | $290,043 |
| 2016 | $5,655 | $470,662 | $186,306 | $284,356 |
| 2015 | $5,633 | $463,593 | $183,508 | $280,085 |
| 2014 | $5,348 | $454,513 | $179,914 | $274,599 |
Source: Public Records
Map
Nearby Homes
- 1900 Chestnut St
- 1752 Beech St
- 2200 Agnew Rd Unit 212
- 2200 Agnew Rd Unit 118
- 1883 Agnew Rd Unit 301
- 1883 Agnew Rd Unit 341
- 1883 Agnew Rd Unit 367
- 4503 Cheeney St
- 1898 Garzoni Place
- 1901 Garzoni Place Unit 405
- 930 Clyde Ave
- 920 Clyde Ave
- 4676 Wilcox Ave
- 4699 Snead Dr
- 783 Laurie Ave
- 2313 Villa Place
- 4464 Laird Cir
- 4012 Fitzpatrick Way Unit 3
- 3901 Lick Mill Blvd Unit 358
- 3901 Lick Mill Blvd Unit 430
- 4124 Cheeney St
- 4104 Cheeney St
- 4134 Cheeney St
- 4094 Cheeney St
- 4144 Cheeney St
- 4074 Cheeney St
- 2013 Beech St
- 4154 Cheeney St
- 4064 Cheeney St
- 2000 Beech St
- 4133 Cheeney St
- 4166 Cheeney St
- 2009 Beech St
- 4143 Cheeney St
- 4054 Cheeney St
- 1952 Beech St
- 4153 Cheeney St
- 4063 Cheeney St
- 4174 Cheeney St
- 4044 Cheeney St