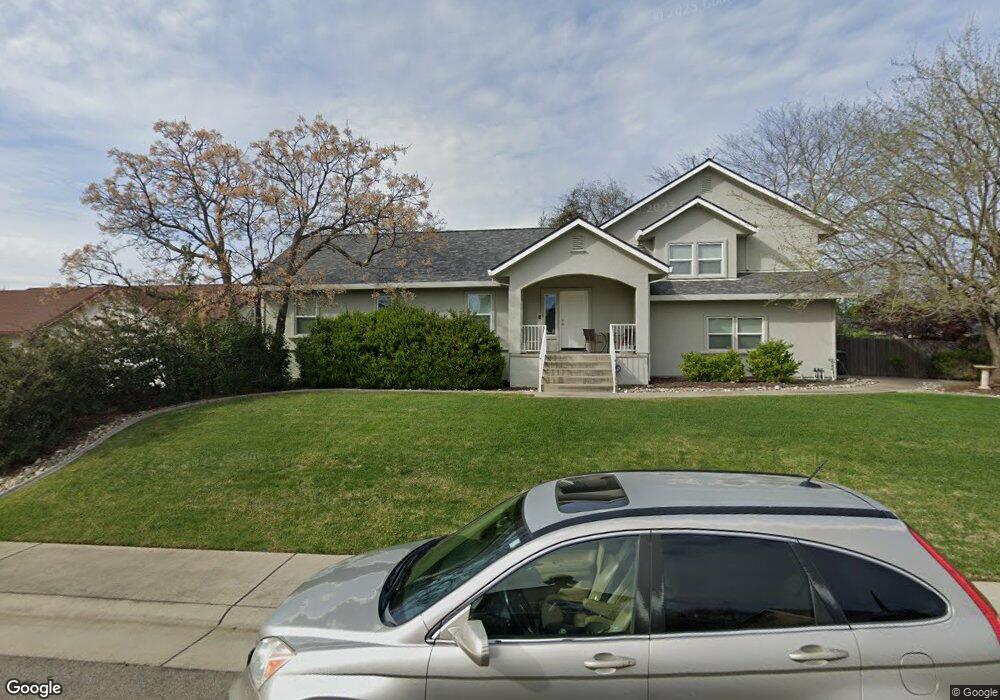
4114 Jan Ct Rocklin, CA 95677
Central Rocklin NeighborhoodEstimated Value: $455,000 - $592,000
2
Beds
1
Bath
1,158
Sq Ft
$441/Sq Ft
Est. Value
About This Home
This home is located at 4114 Jan Ct, Rocklin, CA 95677 and is currently estimated at $510,156, approximately $440 per square foot. 4114 Jan Ct is a home located in Placer County with nearby schools including Rocklin Elementary School, Spring View Middle School, and Rocklin High.
Ownership History
Date
Name
Owned For
Owner Type
Purchase Details
Closed on
Apr 6, 2015
Sold by
Swithenbank Sherry A
Bought by
Swithenbank Sherry A
Current Estimated Value
Purchase Details
Closed on
Apr 26, 2004
Sold by
Killingsworth Partners Inc
Bought by
Swithenbank Sherry A
Home Financials for this Owner
Home Financials are based on the most recent Mortgage that was taken out on this home.
Original Mortgage
$280,000
Outstanding Balance
$127,762
Interest Rate
5.12%
Mortgage Type
Unknown
Estimated Equity
$382,394
Create a Home Valuation Report for This Property
The Home Valuation Report is an in-depth analysis detailing your home's value as well as a comparison with similar homes in the area
Home Values in the Area
Average Home Value in this Area
Purchase History
| Date | Buyer | Sale Price | Title Company |
|---|---|---|---|
| Swithenbank Sherry A | -- | None Available | |
| Swithenbank Sherry A | $358,500 | Alliance Title |
Source: Public Records
Mortgage History
| Date | Status | Borrower | Loan Amount |
|---|---|---|---|
| Open | Swithenbank Sherry A | $280,000 |
Source: Public Records
Tax History
| Year | Tax Paid | Tax Assessment Tax Assessment Total Assessment is a certain percentage of the fair market value that is determined by local assessors to be the total taxable value of land and additions on the property. | Land | Improvement |
|---|---|---|---|---|
| 2025 | $5,558 | $509,695 | $142,171 | $367,524 |
| 2023 | $5,558 | $440,000 | $122,700 | $317,300 |
| 2022 | $4,552 | $405,000 | $113,000 | $292,000 |
| 2021 | $4,115 | $362,000 | $101,000 | $261,000 |
| 2020 | $4,039 | $352,000 | $98,200 | $253,800 |
| 2019 | $4,219 | $366,000 | $102,100 | $263,900 |
| 2018 | $3,565 | $310,000 | $86,500 | $223,500 |
| 2017 | $3,410 | $290,000 | $80,900 | $209,100 |
| 2016 | $3,051 | $261,000 | $72,800 | $188,200 |
| 2015 | $2,990 | $255,000 | $71,100 | $183,900 |
| 2014 | -- | $239,000 | $66,700 | $172,300 |
Source: Public Records
Map
Nearby Homes
- 5505 S Grove St Unit 71
- 5505 S Grove St Unit 101
- 5505 S Grove St Unit 119
- 5505 S Grove St Unit 316
- 5505 S Grove St Unit 29
- 3916 Wickman Loop
- 3819 Anders Way
- 4107 Hard Rock Ct
- 4184 Oakview Dr
- 5208 Levison Way
- 4298 Oakwood St
- 4275 Fernwood St
- 5967 Woodside Dr
- 5810 Elmwood Ct
- 4271 Fernwood St
- 4305 Fernwood St Unit 44
- 4279 Fernwood St Unit 39
- 5500 China Garden Rd
- 6005 Woodside Dr
- 4466 Greenbrae Rd