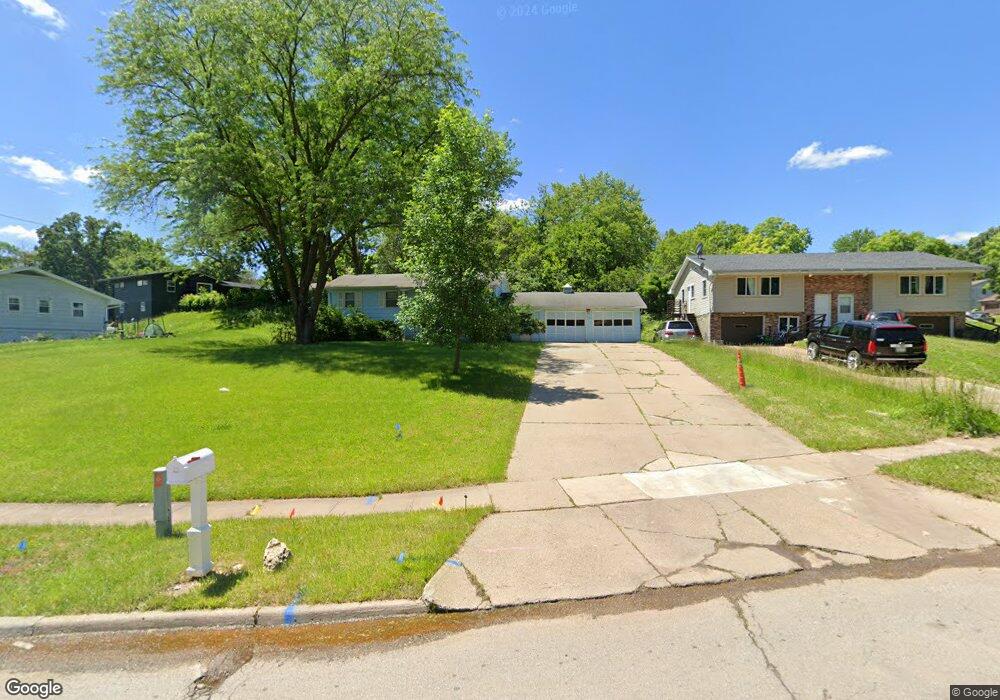
4114 Mlk jr Pkwy Des Moines, IA 50310
Lower Beaver NeighborhoodEstimated Value: $171,774 - $314,000
3
Beds
2
Baths
960
Sq Ft
$246/Sq Ft
Est. Value
About This Home
This home is located at 4114 Mlk jr Pkwy, Des Moines, IA 50310 and is currently estimated at $235,694, approximately $245 per square foot. 4114 Mlk jr Pkwy is a home located in Polk County with nearby schools including Samuelson Elementary School, Meredith Middle School, and Hoover High School.
Ownership History
Date
Name
Owned For
Owner Type
Purchase Details
Closed on
Dec 2, 2024
Sold by
Drj Investments Llc
Bought by
Precision Trim Llc
Current Estimated Value
Home Financials for this Owner
Home Financials are based on the most recent Mortgage that was taken out on this home.
Original Mortgage
$168,000
Interest Rate
6.54%
Mortgage Type
Construction
Purchase Details
Closed on
Sep 11, 2024
Sold by
Allen-Sommerville Lenola B and Busby Lenola
Bought by
Drj Investments Llc
Home Financials for this Owner
Home Financials are based on the most recent Mortgage that was taken out on this home.
Original Mortgage
$145,962
Interest Rate
6.47%
Mortgage Type
New Conventional
Create a Home Valuation Report for This Property
The Home Valuation Report is an in-depth analysis detailing your home's value as well as a comparison with similar homes in the area
Home Values in the Area
Average Home Value in this Area
Purchase History
| Date | Buyer | Sale Price | Title Company |
|---|---|---|---|
| Precision Trim Llc | $166,000 | None Listed On Document | |
| Precision Trim Llc | $166,000 | None Listed On Document | |
| Drj Investments Llc | $145,000 | None Listed On Document |
Source: Public Records
Mortgage History
| Date | Status | Borrower | Loan Amount |
|---|---|---|---|
| Closed | Precision Trim Llc | $168,000 | |
| Previous Owner | Drj Investments Llc | $145,962 |
Source: Public Records
Tax History Compared to Growth
Tax History
| Year | Tax Paid | Tax Assessment Tax Assessment Total Assessment is a certain percentage of the fair market value that is determined by local assessors to be the total taxable value of land and additions on the property. | Land | Improvement |
|---|---|---|---|---|
| 2025 | $3,842 | $214,300 | $53,200 | $161,100 |
| 2024 | $3,842 | $205,800 | $47,700 | $158,100 |
| 2023 | $3,802 | $205,800 | $47,700 | $158,100 |
| 2022 | $3,772 | $170,200 | $41,000 | $129,200 |
| 2021 | $3,818 | $170,200 | $41,000 | $129,200 |
| 2020 | $3,962 | $161,600 | $38,700 | $122,900 |
| 2019 | $3,566 | $161,600 | $38,700 | $122,900 |
| 2018 | $3,524 | $141,200 | $33,300 | $107,900 |
| 2017 | $3,320 | $141,200 | $33,300 | $107,900 |
| 2016 | $3,230 | $131,300 | $30,500 | $100,800 |
| 2015 | $3,230 | $131,300 | $30,500 | $100,800 |
| 2014 | $2,976 | $125,100 | $28,600 | $96,500 |
Source: Public Records
Map
Nearby Homes
- 4114 Martin Luther King Junior Pkwy
- 2601 Glennor Rd
- 2601 Sherwood Dr
- 2709 Madison Ave
- 3918 Martin Luther King jr Pkwy
- 3914 Dosh Rd
- 4017 30th St
- 3941 30th St
- 3913 30th St
- 3008 Aurora Ave
- 3010 Madison Ave
- 3018 Shawnee Ave
- 3103 Lawnview Dr
- 3027 Shawnee Ave
- 3015 Seneca Ave
- 3111 Madison Ave
- 3913 Lawnwoods Dr
- 3533 27th Place
- 3207 Vilura Pkwy
- 3124 Valdez Dr
- 4120-4122 Mlk jr Pkwy
- 4122 Martin Luther King Junior Pkwy
- 4120 Martin Luther King Junior Pkwy
- 4120 Mlk jr Pkwy
- 2503 Glennor Rd
- 2512 Madison Ave
- 2520 Madison Ave
- 2521 Glennor Rd
- 2509 Madison Ave
- 2528 Madison Ave
- 2502 Glennor Rd
- 2500 Glennor Rd
- 2527 Glennor Rd
- 2508 Glennor Rd
- 2514 Glennor Rd
- 2525 Madison Ave
- 2533 Glennor Rd
- 2520 Glennor Rd
- 2531 Madison Ave
- 2538 Madison Ave