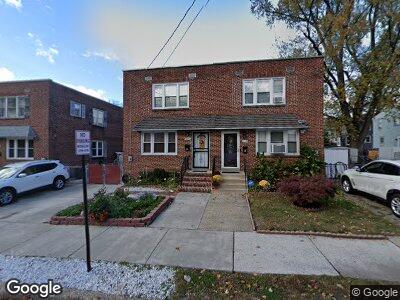
4115 Camden Ave Pennsauken, NJ 08110
Rosedale NeighborhoodEstimated Value: $195,706 - $240,000
--
Bed
--
Bath
1,296
Sq Ft
$169/Sq Ft
Est. Value
About This Home
This home is located at 4115 Camden Ave, Pennsauken, NJ 08110 and is currently estimated at $218,677, approximately $168 per square foot. 4115 Camden Ave is a home located in Camden County with nearby schools including Davis Elementary School, Eastside High School, and St. Cecilia School.
Ownership History
Date
Name
Owned For
Owner Type
Purchase Details
Closed on
Nov 30, 2006
Sold by
Gunther Priscilla S
Bought by
Sanchez Rafael Batista
Current Estimated Value
Home Financials for this Owner
Home Financials are based on the most recent Mortgage that was taken out on this home.
Original Mortgage
$114,098
Outstanding Balance
$71,601
Interest Rate
6.31%
Mortgage Type
FHA
Purchase Details
Closed on
Oct 26, 2001
Sold by
Bundy Lelia P
Bought by
Gunther Priscilla S
Home Financials for this Owner
Home Financials are based on the most recent Mortgage that was taken out on this home.
Original Mortgage
$63,011
Interest Rate
6.64%
Mortgage Type
FHA
Create a Home Valuation Report for This Property
The Home Valuation Report is an in-depth analysis detailing your home's value as well as a comparison with similar homes in the area
Home Values in the Area
Average Home Value in this Area
Purchase History
| Date | Buyer | Sale Price | Title Company |
|---|---|---|---|
| Sanchez Rafael Batista | $115,000 | -- | |
| Gunther Priscilla S | $64,000 | -- |
Source: Public Records
Mortgage History
| Date | Status | Borrower | Loan Amount |
|---|---|---|---|
| Open | Sanchez Rafael Batista | $53,000 | |
| Open | Sanchez Rafael Batista | $114,098 | |
| Previous Owner | Gunther Priscilla S | $63,011 |
Source: Public Records
Tax History Compared to Growth
Tax History
| Year | Tax Paid | Tax Assessment Tax Assessment Total Assessment is a certain percentage of the fair market value that is determined by local assessors to be the total taxable value of land and additions on the property. | Land | Improvement |
|---|---|---|---|---|
| 2024 | $2,740 | $80,000 | $21,200 | $58,800 |
| 2023 | $2,740 | $80,000 | $21,200 | $58,800 |
| 2022 | $2,689 | $80,000 | $21,200 | $58,800 |
| 2021 | $2,043 | $80,000 | $21,200 | $58,800 |
| 2020 | $2,544 | $80,000 | $21,200 | $58,800 |
| 2019 | $2,436 | $80,000 | $21,200 | $58,800 |
| 2018 | $2,344 | $80,000 | $21,200 | $58,800 |
| 2017 | $2,287 | $80,000 | $21,200 | $58,800 |
| 2016 | $2,214 | $80,000 | $21,200 | $58,800 |
| 2015 | $2,132 | $80,000 | $21,200 | $58,800 |
| 2014 | $2,081 | $77,400 | $21,200 | $56,200 |
Source: Public Records
Map
Nearby Homes