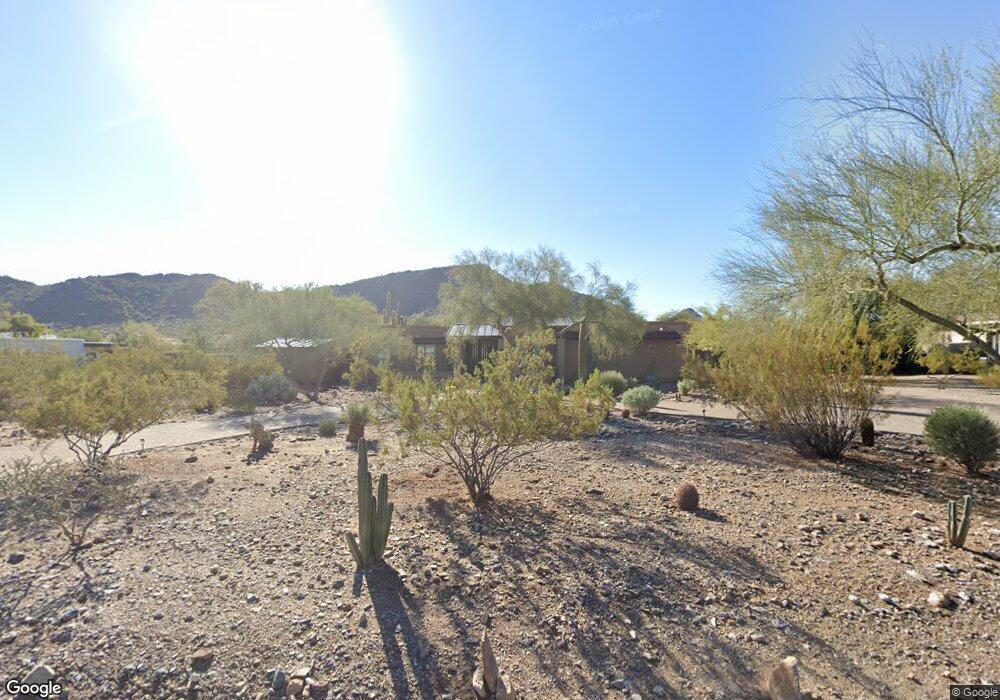
4115 E Mountain View Rd Phoenix, AZ 85028
Paradise Valley Village NeighborhoodEstimated Value: $1,041,000 - $1,418,000
3
Beds
2
Baths
2,079
Sq Ft
$621/Sq Ft
Est. Value
About This Home
This home is located at 4115 E Mountain View Rd, Phoenix, AZ 85028 and is currently estimated at $1,291,172, approximately $621 per square foot. 4115 E Mountain View Rd is a home located in Maricopa County with nearby schools including Cherokee Elementary School, Cocopah Middle School, and Chaparral High School.
Ownership History
Date
Name
Owned For
Owner Type
Purchase Details
Closed on
Feb 25, 2016
Sold by
Diner Jeffre
Bought by
Jeffrey Diner Trust
Current Estimated Value
Purchase Details
Closed on
Nov 4, 2003
Sold by
Fretz David C and Fretz Paula M
Bought by
Diner Jeffrey
Home Financials for this Owner
Home Financials are based on the most recent Mortgage that was taken out on this home.
Original Mortgage
$384,000
Interest Rate
5.98%
Mortgage Type
Credit Line Revolving
Purchase Details
Closed on
Mar 5, 2002
Sold by
Furr Lois J and Furr Craig A
Bought by
Fretz David C and Fretz Paula M
Home Financials for this Owner
Home Financials are based on the most recent Mortgage that was taken out on this home.
Original Mortgage
$288,000
Interest Rate
6.94%
Mortgage Type
New Conventional
Purchase Details
Closed on
Nov 1, 1996
Sold by
Furr Lois J and Furr Craig A
Bought by
Furr Lois J and Furr Craig A
Create a Home Valuation Report for This Property
The Home Valuation Report is an in-depth analysis detailing your home's value as well as a comparison with similar homes in the area
Home Values in the Area
Average Home Value in this Area
Purchase History
| Date | Buyer | Sale Price | Title Company |
|---|---|---|---|
| Jeffrey Diner Trust | -- | None Available | |
| Diner Jeffrey | $481,300 | North American Title Co | |
| Fretz David C | $360,000 | First American Title | |
| Furr Lois J | -- | -- |
Source: Public Records
Mortgage History
| Date | Status | Borrower | Loan Amount |
|---|---|---|---|
| Closed | Diner Jeffrey | $384,000 | |
| Previous Owner | Fretz David C | $288,000 | |
| Closed | Diner Jeffrey | $49,170 |
Source: Public Records
Tax History
| Year | Tax Paid | Tax Assessment Tax Assessment Total Assessment is a certain percentage of the fair market value that is determined by local assessors to be the total taxable value of land and additions on the property. | Land | Improvement |
|---|---|---|---|---|
| 2025 | $4,223 | $58,607 | -- | -- |
| 2024 | $3,914 | $55,816 | -- | -- |
| 2023 | $3,914 | $78,170 | $15,630 | $62,540 |
| 2022 | $3,729 | $55,100 | $11,020 | $44,080 |
| 2021 | $3,913 | $48,400 | $9,680 | $38,720 |
| 2020 | $3,851 | $45,920 | $9,180 | $36,740 |
| 2019 | $3,784 | $46,530 | $9,300 | $37,230 |
| 2018 | $3,664 | $43,520 | $8,700 | $34,820 |
| 2017 | $3,476 | $46,470 | $9,290 | $37,180 |
| 2016 | $3,382 | $46,850 | $9,370 | $37,480 |
Source: Public Records
Map
Nearby Homes
- 4108 E Fanfol Dr
- 4041 E Mountain View Rd
- 9249 N 40th St
- 4143 E Beryl Ln
- 9420 N 38th St
- 4001 E Becker Ln Unit 8
- 4344 E Shea Blvd
- 9817 N 36th St
- 10310 N 37th St
- 4109 E Mercer Ln
- 9825 N 35th Place
- 9618 N 35th Place
- 8955 N 45th St
- 3929 E Mercer Ln
- 4634 E Mountain View Rd
- 10635 N 44th Ct
- 4641 E Mountain View Rd
- 4224 E Desert Cove Ave
- 3802 E Mercer Ln
- 3833 E Desert Cove Ave
- 4119 E Mountain View Rd
- 4101 E Mountain View Rd
- 4110 E Mountain View Rd
- 4043 E Mountain View Rd
- 4116 E Mountain View Rd
- 4125 E Mountain View Rd
- 4125 E Mountain View Rd Unit Rear
- 9621 N 40th Place
- 4102 E Mountain View Rd
- 4120 E Fanfol Dr
- 4127 E Mountain View Rd
- 4130 E Mountain View Rd
- 4124 E Fanfol Dr
- 4124 E Fanfol Dr
- 4042 E Fanfol Dr
- 4041 E Mountain View Rd
- 4138 E Mountain View Rd
- 4128 E Fanfol Dr
- 4201 E Vogel Ave
- 4202 E Vogel Ave
Your Personal Tour Guide
Ask me questions while you tour the home.