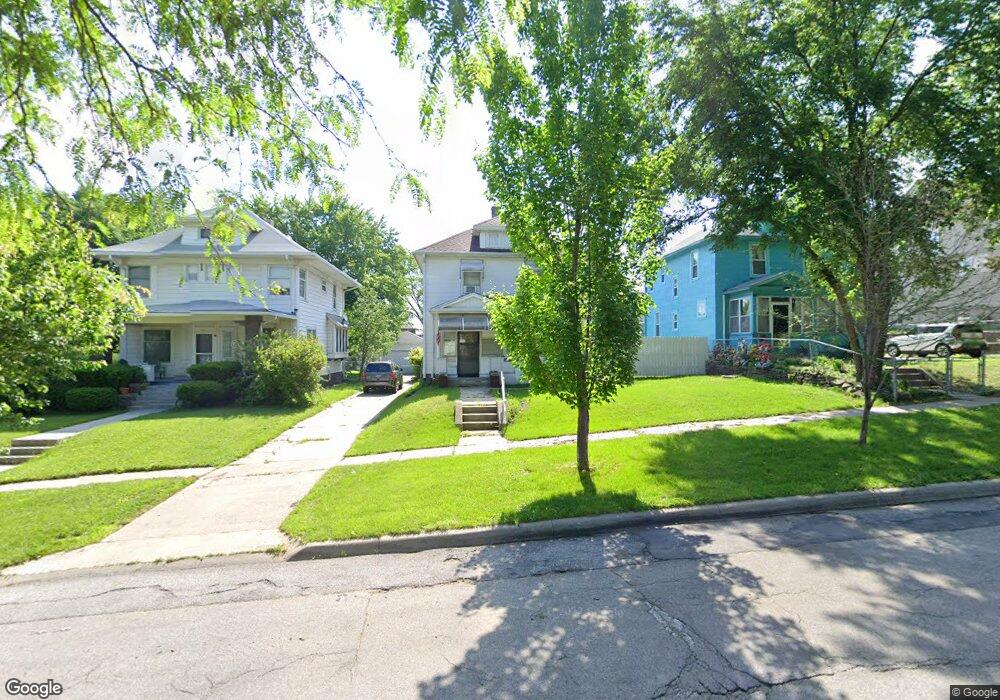
4115 S 23rd St Omaha, NE 68107
South Central Omaha NeighborhoodEstimated Value: $188,762 - $276,000
4
Beds
2
Baths
1,508
Sq Ft
$151/Sq Ft
Est. Value
About This Home
This home is located at 4115 S 23rd St, Omaha, NE 68107 and is currently estimated at $227,941, approximately $151 per square foot. 4115 S 23rd St is a home located in Douglas County with nearby schools including Spring Lake Magnet Center, R.M. Marrs Magnet Middle School, and South High School.
Ownership History
Date
Name
Owned For
Owner Type
Purchase Details
Closed on
Apr 13, 2021
Sold by
Vance Cheri and Snell Cheri
Bought by
Snell Cheri and Snell Gary
Current Estimated Value
Purchase Details
Closed on
Nov 8, 2011
Sold by
Federal National Mortgage Association
Bought by
Vance Cheri Lynne
Home Financials for this Owner
Home Financials are based on the most recent Mortgage that was taken out on this home.
Original Mortgage
$38,000
Outstanding Balance
$25,912
Interest Rate
4.02%
Mortgage Type
New Conventional
Estimated Equity
$202,029
Purchase Details
Closed on
Apr 11, 2011
Sold by
Garcia Jose Casillas and Hernandez Cherry
Bought by
Fannie Mae and Federal National Mortgage Association
Purchase Details
Closed on
Dec 26, 2006
Sold by
Hernandez Marilyn
Bought by
Garcia Jose C
Create a Home Valuation Report for This Property
The Home Valuation Report is an in-depth analysis detailing your home's value as well as a comparison with similar homes in the area
Home Values in the Area
Average Home Value in this Area
Purchase History
| Date | Buyer | Sale Price | Title Company |
|---|---|---|---|
| Snell Cheri | -- | None Available | |
| Vance Cheri Lynne | -- | Dodge Title & Escrow Co Llc | |
| Fannie Mae | $109,320 | None Available | |
| Garcia Jose C | $110,800 | -- |
Source: Public Records
Mortgage History
| Date | Status | Borrower | Loan Amount |
|---|---|---|---|
| Open | Vance Cheri Lynne | $38,000 |
Source: Public Records
Tax History Compared to Growth
Tax History
| Year | Tax Paid | Tax Assessment Tax Assessment Total Assessment is a certain percentage of the fair market value that is determined by local assessors to be the total taxable value of land and additions on the property. | Land | Improvement |
|---|---|---|---|---|
| 2024 | $1,506 | $150,700 | $15,600 | $135,100 |
| 2023 | $1,506 | $150,700 | $15,600 | $135,100 |
| 2022 | $2,064 | $122,400 | $13,600 | $108,800 |
| 2021 | $2,591 | $122,400 | $13,600 | $108,800 |
| 2020 | $2,351 | $109,800 | $6,300 | $103,500 |
| 2019 | $1,658 | $77,200 | $6,300 | $70,900 |
| 2018 | $1,847 | $85,900 | $6,300 | $79,600 |
| 2017 | $1,843 | $85,900 | $6,300 | $79,600 |
| 2016 | $1,843 | $85,900 | $6,300 | $79,600 |
| 2015 | $1,819 | $85,900 | $6,300 | $79,600 |
| 2014 | $1,819 | $85,900 | $6,300 | $79,600 |
Source: Public Records
Map
Nearby Homes