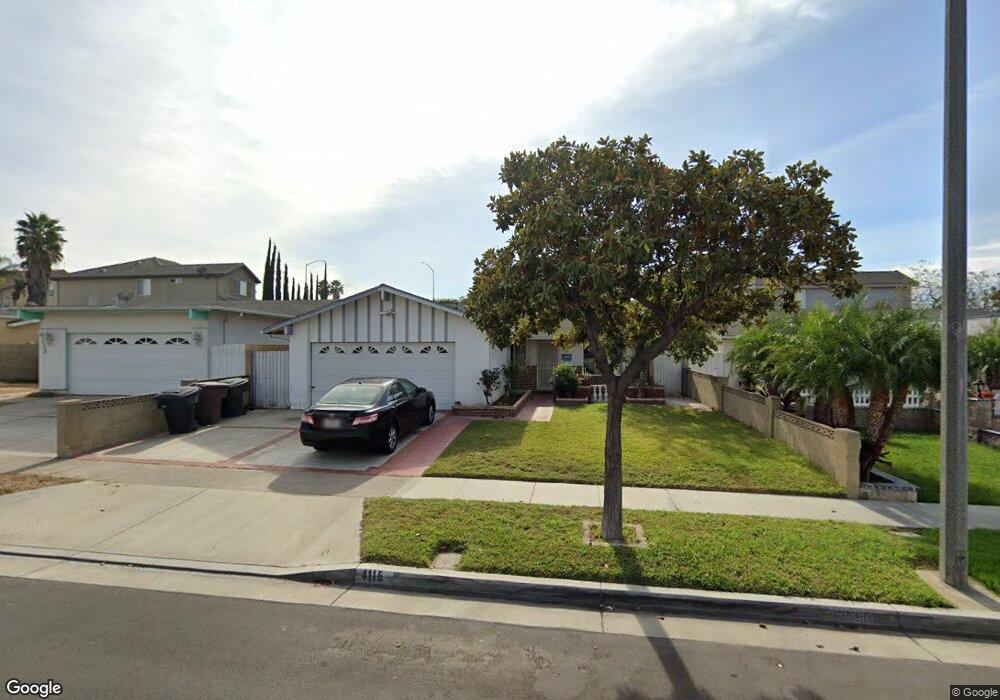
4116 E Addington Dr Anaheim, CA 92807
Anaheim Hills NeighborhoodEstimated Value: $888,829 - $929,000
3
Beds
2
Baths
1,240
Sq Ft
$732/Sq Ft
Est. Value
About This Home
This home is located at 4116 E Addington Dr, Anaheim, CA 92807 and is currently estimated at $907,457, approximately $731 per square foot. 4116 E Addington Dr is a home located in Orange County with nearby schools including Olive Elementary School, Canyon High School, and El Rancho Charter.
Ownership History
Date
Name
Owned For
Owner Type
Purchase Details
Closed on
Oct 19, 2010
Sold by
Mora Fernando Maciel
Bought by
Kothari Parag Kanaiyalal and Kothari Mukul Parag
Current Estimated Value
Home Financials for this Owner
Home Financials are based on the most recent Mortgage that was taken out on this home.
Original Mortgage
$172,500
Outstanding Balance
$113,716
Interest Rate
4.33%
Mortgage Type
New Conventional
Estimated Equity
$793,741
Purchase Details
Closed on
Feb 24, 2001
Sold by
Periera Elena Maciel Mora and Periera Stephen
Bought by
Mora Fernando Maciel
Home Financials for this Owner
Home Financials are based on the most recent Mortgage that was taken out on this home.
Original Mortgage
$114,000
Interest Rate
6.98%
Purchase Details
Closed on
Apr 20, 1994
Sold by
Mora Lorenzo and Mora Reynalda M
Bought by
Mora Fernando Maciel and Mora Elena Maciel
Create a Home Valuation Report for This Property
The Home Valuation Report is an in-depth analysis detailing your home's value as well as a comparison with similar homes in the area
Home Values in the Area
Average Home Value in this Area
Purchase History
| Date | Buyer | Sale Price | Title Company |
|---|---|---|---|
| Kothari Parag Kanaiyalal | $345,000 | Ticor Title Tustin Orange Co | |
| Mora Fernando Maciel | -- | -- | |
| Mora Fernando Maciel | -- | -- |
Source: Public Records
Mortgage History
| Date | Status | Borrower | Loan Amount |
|---|---|---|---|
| Open | Kothari Parag Kanaiyalal | $172,500 | |
| Previous Owner | Mora Fernando Maciel | $114,000 |
Source: Public Records
Tax History Compared to Growth
Tax History
| Year | Tax Paid | Tax Assessment Tax Assessment Total Assessment is a certain percentage of the fair market value that is determined by local assessors to be the total taxable value of land and additions on the property. | Land | Improvement |
|---|---|---|---|---|
| 2025 | $4,898 | $442,000 | $359,207 | $82,793 |
| 2024 | $4,898 | $433,334 | $352,164 | $81,170 |
| 2023 | $4,787 | $424,838 | $345,259 | $79,579 |
| 2022 | $4,692 | $416,508 | $338,489 | $78,019 |
| 2021 | $4,562 | $408,342 | $331,852 | $76,490 |
| 2020 | $4,519 | $404,155 | $328,449 | $75,706 |
| 2019 | $4,462 | $396,231 | $322,009 | $74,222 |
| 2018 | $4,393 | $388,462 | $315,695 | $72,767 |
| 2017 | $4,212 | $380,846 | $309,505 | $71,341 |
| 2016 | $4,131 | $373,379 | $303,436 | $69,943 |
| 2015 | $4,076 | $367,771 | $298,878 | $68,893 |
| 2014 | $3,988 | $360,567 | $293,023 | $67,544 |
Source: Public Records
Map
Nearby Homes
- 413 N Conestoga Way Unit 11
- 242 N Pageant St
- 124 N Tustin Ave
- 500 N Tustin Ave Unit 218
- 3999 E Santa Ana Canyon Rd Unit 106
- 419 N Tustin Ave
- 4179 N Santa Lucia St
- 408 N Torrens St
- 4353 E Bluewater Cir
- 4062 N Santa Anita St
- 4263 E Ranch Gate Rd
- 4530 E Langdon Dr
- 4419 E Orange Creek Ln
- 3032 N Oceanview St
- 450 S Mountain Glen Rd
- 3211 E Mandeville Place
- 451 S Wishing Well Ln
- 4809 E Wasatch Dr
- 3148 E East Abbey Ln
- 1231 E Boom Ave
- 4118 E Addington Dr
- 4114 E Addington Dr
- 4035 E Summer Creek Ln
- 4112 E Addington Dr
- 4120 E Addington Dr
- 4110 E Addington Dr
- 4122 E Addington Dr
- 4045 E Summer Creek Ln
- 4125 E Fauna Ave
- 4025 E Summer Creek Ln
- 4124 E Addington Dr
- 4108 E Addington Dr
- 4131 E Fauna Ave
- 4126 E Fauna Ave
- 4065 E Summer Creek Ln
- 4135 E Fauna Ave
- 4106 E Addington Dr
- 4126 E Addington Dr
- 4116 E Bainbridge Ave
- 4120 E Bainbridge Ave