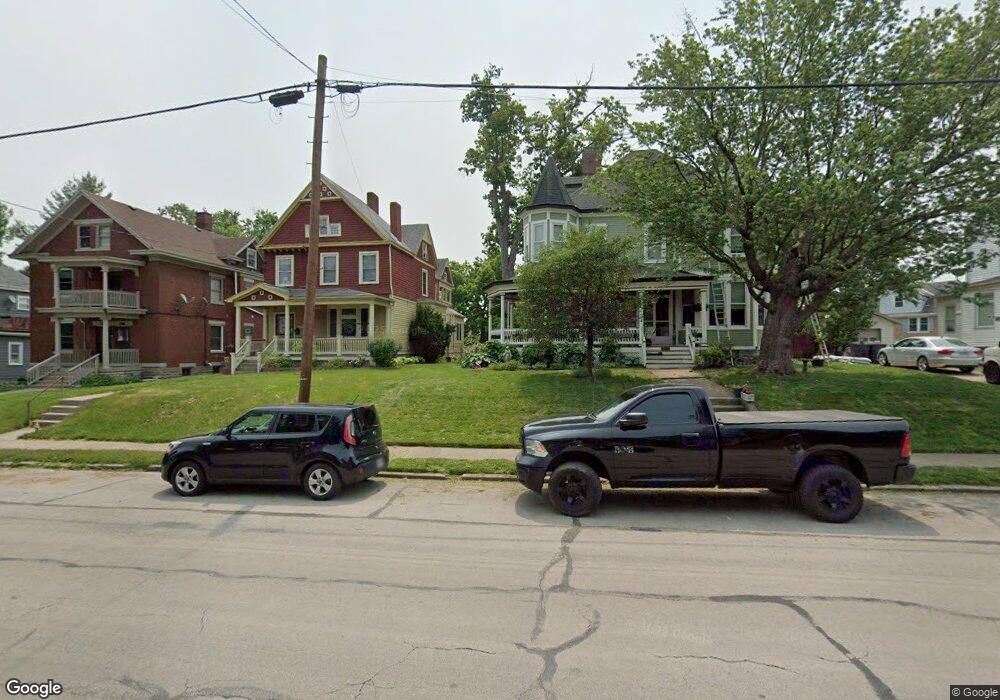
4116 Forest Ave Unit THIRTY Cincinnati, OH 45212
Estimated Value: $383,327 - $458,000
3
Beds
1
Bath
1,305
Sq Ft
$309/Sq Ft
Est. Value
About This Home
This home is located at 4116 Forest Ave Unit THIRTY, Cincinnati, OH 45212 and is currently estimated at $403,332, approximately $309 per square foot. 4116 Forest Ave Unit THIRTY is a home located in Hamilton County with nearby schools including Norwood High School, Cornerstone Christian Academy, and Immaculate Conception Academy.
Ownership History
Date
Name
Owned For
Owner Type
Purchase Details
Closed on
Apr 1, 2004
Sold by
Wetzel Joan D
Bought by
Wetzel Stephen J and Wetzel Joan D
Current Estimated Value
Home Financials for this Owner
Home Financials are based on the most recent Mortgage that was taken out on this home.
Original Mortgage
$153,600
Outstanding Balance
$70,080
Interest Rate
5.66%
Mortgage Type
New Conventional
Estimated Equity
$333,252
Purchase Details
Closed on
Nov 13, 1998
Sold by
Mmps Inc
Bought by
Wetzel Joan D
Home Financials for this Owner
Home Financials are based on the most recent Mortgage that was taken out on this home.
Original Mortgage
$120,757
Interest Rate
7.01%
Mortgage Type
FHA
Purchase Details
Closed on
Aug 13, 1998
Sold by
Pell Melvin H
Bought by
Mmps Inc
Home Financials for this Owner
Home Financials are based on the most recent Mortgage that was taken out on this home.
Original Mortgage
$98,000
Interest Rate
7.5%
Create a Home Valuation Report for This Property
The Home Valuation Report is an in-depth analysis detailing your home's value as well as a comparison with similar homes in the area
Home Values in the Area
Average Home Value in this Area
Purchase History
| Date | Buyer | Sale Price | Title Company |
|---|---|---|---|
| Wetzel Stephen J | -- | -- | |
| Wetzel Joan D | $125,000 | Blue Chip Title Agency Inc | |
| Mmps Inc | $80,000 | -- |
Source: Public Records
Mortgage History
| Date | Status | Borrower | Loan Amount |
|---|---|---|---|
| Open | Wetzel Stephen J | $153,600 | |
| Closed | Wetzel Joan D | $120,757 | |
| Previous Owner | Mmps Inc | $98,000 |
Source: Public Records
Tax History
| Year | Tax Paid | Tax Assessment Tax Assessment Total Assessment is a certain percentage of the fair market value that is determined by local assessors to be the total taxable value of land and additions on the property. | Land | Improvement |
|---|---|---|---|---|
| 2025 | $6,451 | $104,735 | $38,798 | $65,937 |
| 2023 | $6,398 | $104,735 | $38,798 | $65,937 |
| 2022 | $6,511 | $95,677 | $23,272 | $72,405 |
| 2021 | $6,269 | $95,677 | $23,272 | $72,405 |
| 2020 | $6,452 | $95,677 | $23,272 | $72,405 |
| 2019 | $5,878 | $79,731 | $19,394 | $60,337 |
| 2018 | $5,887 | $79,731 | $19,394 | $60,337 |
| 2017 | $5,594 | $79,731 | $19,394 | $60,337 |
| 2016 | $5,014 | $70,403 | $14,739 | $55,664 |
| 2015 | $4,519 | $70,403 | $14,739 | $55,664 |
| 2014 | $4,552 | $70,403 | $14,739 | $55,664 |
| 2013 | $4,249 | $64,590 | $13,521 | $51,069 |
Source: Public Records
Map
Nearby Homes
- 4010 S Jefferson Ave
- 3937 Grove Ave
- 3933 Grove Ave
- 3950 Elsmere Ave
- 2223 Madison Ave
- 2418 Morton Ave
- 4317 Smith Rd
- 4206 Lafayette Ave
- 2119 Slane Ave
- 4308 Smith Rd
- 4108 Montgomery Rd
- 3766 Floral Ave
- 3758 Floral Ave
- 2604 Melrose Ave
- 3764 Grovedale Place
- 2620 Melrose Ave
- 2493 Downing Dr
- 3756 Regent Ave
- 1931 Waverly Ave
- 2432 Robertson Ave
- 4118 Forest Ave Unit THIRTY
- 4118 Forest Ave Unit THIRTY
- 4108 Forest Ave
- 4112 Forest Ave Unit THIRTY
- 4114 Forest Ave Unit 30
- 4114 Forest Ave
- 4114 Forest Ave Unit THIRTY
- 4110 Forest Ave Unit THIRTY
- 4106 Forest Ave
- 4126 Forest Ave Unit THIRTY
- 4117 Forest Ave Unit THIRTY
- 4113 Forest Ave Unit THIRTY
- 4111 Forest Ave Unit THIRTY
- 4123 Forest Ave Unit THIRTY
- 4123 Forest Ave Unit THIRTY
- 4120 Forest Ave
- 4120 Forest Ave Unit THIRTY
- 4125 Forest Ave Unit THIRTY
- 4033 Burwood Ave
- 4129 Forest Ave Unit THIRTY