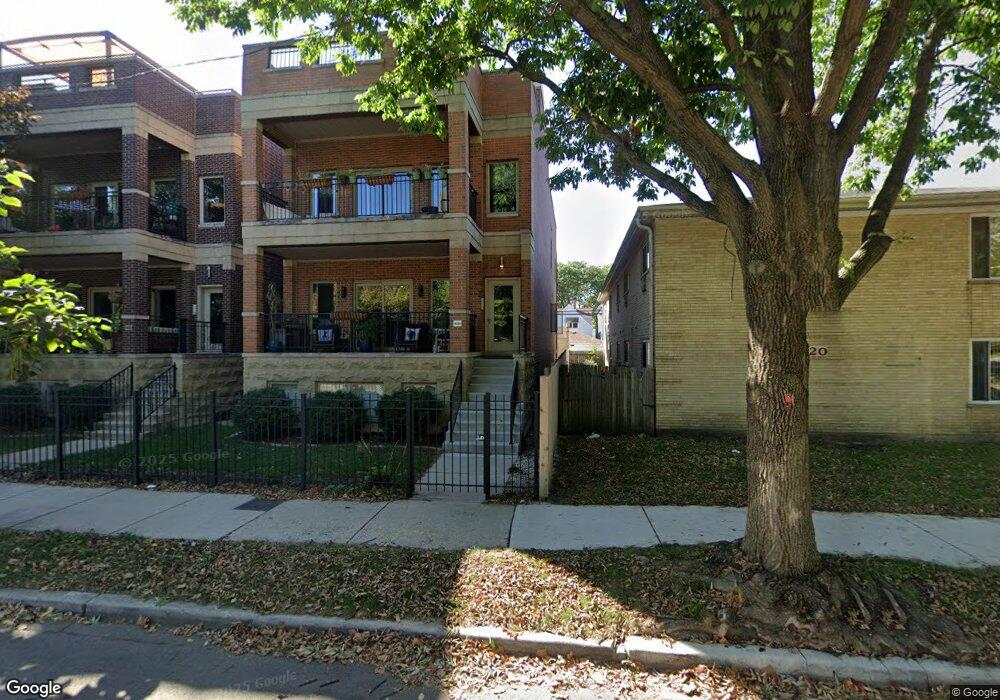
4116 N California Ave Unit 4116 Chicago, IL 60618
Irving Park NeighborhoodEstimated Value: $514,000 - $536,000
2
Beds
2
Baths
1,650
Sq Ft
$316/Sq Ft
Est. Value
About This Home
This home is located at 4116 N California Ave Unit 4116, Chicago, IL 60618 and is currently estimated at $521,344, approximately $315 per square foot. 4116 N California Ave Unit 4116 is a home located in Cook County with nearby schools including Bateman Elementary School, Roosevelt High School, and Chicago Jewish Day School.
Ownership History
Date
Name
Owned For
Owner Type
Purchase Details
Closed on
Jun 14, 2021
Sold by
Bhat Neel M and Donthamsetti Namrata
Bought by
Tran Minh and Wang Emily
Current Estimated Value
Purchase Details
Closed on
May 10, 2018
Sold by
Waguespack Sylvestre and Buchanan Linda
Bought by
Bhat Neel M and Donthamsetti Namrata
Purchase Details
Closed on
May 25, 2014
Sold by
Pittas Brian D and Pittas Alison K
Bought by
Buchanan Linda and Waguespack Sylvestre
Purchase Details
Closed on
Sep 12, 2008
Sold by
4110-18 California Llc
Bought by
Pittas Brian D and Pittas Alison K
Home Financials for this Owner
Home Financials are based on the most recent Mortgage that was taken out on this home.
Original Mortgage
$378,000
Interest Rate
6.57%
Mortgage Type
Purchase Money Mortgage
Create a Home Valuation Report for This Property
The Home Valuation Report is an in-depth analysis detailing your home's value as well as a comparison with similar homes in the area
Home Values in the Area
Average Home Value in this Area
Purchase History
| Date | Buyer | Sale Price | Title Company |
|---|---|---|---|
| Tran Minh | $440,000 | Acquest Title | |
| Bhat Neel M | $407,000 | Prairie Title Company | |
| Buchanan Linda | $405,000 | None Available | |
| Pittas Brian D | $420,000 | Multiple |
Source: Public Records
Mortgage History
| Date | Status | Borrower | Loan Amount |
|---|---|---|---|
| Previous Owner | Pittas Brian D | $378,000 |
Source: Public Records
Tax History Compared to Growth
Tax History
| Year | Tax Paid | Tax Assessment Tax Assessment Total Assessment is a certain percentage of the fair market value that is determined by local assessors to be the total taxable value of land and additions on the property. | Land | Improvement |
|---|---|---|---|---|
| 2024 | $6,497 | $39,569 | $9,362 | $30,207 |
| 2023 | $7,018 | $34,000 | $7,550 | $26,450 |
| 2022 | $7,018 | $34,000 | $7,550 | $26,450 |
| 2021 | $6,859 | $33,999 | $7,549 | $26,450 |
| 2020 | $7,183 | $32,133 | $3,321 | $28,812 |
| 2019 | $7,213 | $35,782 | $3,321 | $32,461 |
| 2018 | $7,248 | $36,575 | $3,321 | $33,254 |
| 2017 | $7,710 | $35,700 | $3,019 | $32,681 |
| 2016 | $6,314 | $35,700 | $3,019 | $32,681 |
| 2015 | $7,006 | $42,596 | $3,019 | $39,577 |
| 2014 | $4,376 | $26,070 | $2,717 | $23,353 |
| 2013 | $4,279 | $26,070 | $2,717 | $23,353 |
Source: Public Records
Map
Nearby Homes
- 4020 N Francisco Ave
- 2714 W Byron St
- 4251 N Mozart St Unit 2S
- 4251 N Mozart St Unit S2
- 3929 N Francisco Ave
- 3908 N Mozart St
- 3024 W Irving Park Rd Unit 1S
- 3835 N Francisco Ave
- 3042 W Irving Park Rd
- 4347 N Richmond St Unit 1N
- 4347 N Richmond St Unit 1S
- 4347 N Richmond St Unit 3N
- 4347 N Richmond St Unit 2N
- 4015 N Albany Ave
- 4343 N Sacramento Ave Unit A-G
- 2468 W Berteau Ave
- 3102 W Berteau Ave Unit 31023
- 4018 N Albany Ave Unit GB
- 4027 N Troy St
- 2438 W Berteau Ave
- 4116 N California Ave Unit 4116
- 4116 N California Ave Unit 2
- 4116 N California Ave Unit 1
- 4108 N California Ave
- 4104 N California Ave Unit 1
- 4110 N California Ave Unit 4110
- 4110 N California Ave Unit 4110
- 4110 N California Ave Unit 2
- 4100 N California Ave Unit 1
- 4112 N California Ave Unit 2
- 4112 N California Ave Unit 4112
- 4112 N California Ave Unit 4112
- 4112 N California Ave Unit 1
- 4120 N California Ave
- 4122 N California Ave
- 4056 N California Ave Unit 3C
- 4056 N California Ave Unit 2A
- 4056 N California Ave Unit 2C
- 4056 N California Ave Unit 2D
- 4056 N California Ave Unit 3A