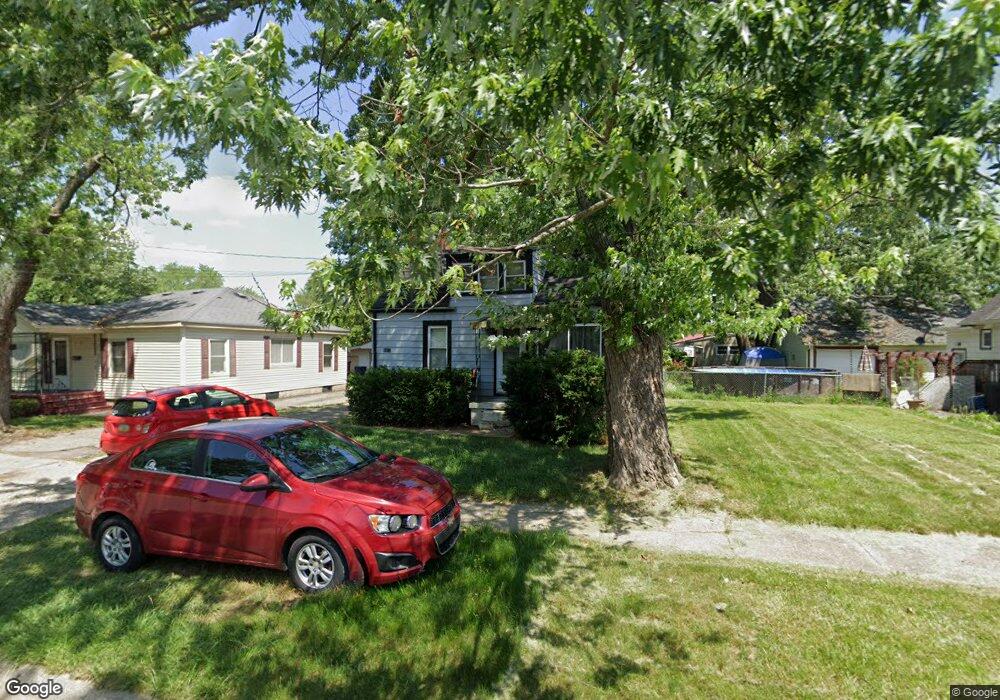
4117 Tuxedo Ave Flint, MI 48507
South Side NeighborhoodEstimated Value: $43,000 - $80,000
2
Beds
2
Baths
816
Sq Ft
$68/Sq Ft
Est. Value
About This Home
This home is located at 4117 Tuxedo Ave, Flint, MI 48507 and is currently estimated at $55,850, approximately $68 per square foot. 4117 Tuxedo Ave is a home located in Genesee County with nearby schools including Neithercut Elementary School, Flint Southwestern Classical Academy, and International Academy of Flint (K-12).
Ownership History
Date
Name
Owned For
Owner Type
Purchase Details
Closed on
Mar 23, 2009
Sold by
Estate Of Wallace E Jones
Bought by
Mcdonald Andrew and Mcdonald Terry L
Current Estimated Value
Purchase Details
Closed on
Oct 5, 2008
Sold by
Pettigrew Shari L and Pettigrew Sharl L
Bought by
Jones David L and Estate Of Wallace Eugene Jones
Purchase Details
Closed on
Oct 30, 2003
Sold by
Federal Home Loan Mortgage Corporation
Bought by
Abn Amro Mortgage Group Inc
Purchase Details
Closed on
Oct 16, 2003
Sold by
Abn Amro Mortgage Group Inc
Bought by
Jones Wallace E
Purchase Details
Closed on
Oct 29, 2002
Sold by
Abn Amro Mtg Group Inc
Bought by
Federal Home Loan Mortgage Corporation
Purchase Details
Closed on
Oct 23, 2002
Sold by
Hutchison Ronald
Bought by
Abn Amro Mtg Group Inc
Create a Home Valuation Report for This Property
The Home Valuation Report is an in-depth analysis detailing your home's value as well as a comparison with similar homes in the area
Home Values in the Area
Average Home Value in this Area
Purchase History
| Date | Buyer | Sale Price | Title Company |
|---|---|---|---|
| Mcdonald Andrew | $39,900 | Sargents Title Company | |
| Jones David L | -- | Centennial Title & Abstract | |
| Abn Amro Mortgage Group Inc | -- | Metro | |
| Jones Wallace E | $44,500 | Metro | |
| Federal Home Loan Mortgage Corporation | -- | -- | |
| Abn Amro Mtg Group Inc | $69,509 | -- |
Source: Public Records
Tax History Compared to Growth
Tax History
| Year | Tax Paid | Tax Assessment Tax Assessment Total Assessment is a certain percentage of the fair market value that is determined by local assessors to be the total taxable value of land and additions on the property. | Land | Improvement |
|---|---|---|---|---|
| 2025 | $901 | $17,400 | $0 | $0 |
| 2024 | $819 | $17,900 | $0 | $0 |
| 2023 | $807 | $14,500 | $0 | $0 |
| 2022 | $0 | $13,000 | $0 | $0 |
| 2021 | $836 | $11,600 | $0 | $0 |
| 2020 | $758 | $11,600 | $0 | $0 |
| 2019 | $827 | $12,100 | $0 | $0 |
| 2018 | $733 | $10,400 | $0 | $0 |
| 2017 | $714 | $0 | $0 | $0 |
| 2016 | $709 | $0 | $0 | $0 |
| 2015 | -- | $0 | $0 | $0 |
| 2014 | -- | $0 | $0 | $0 |
| 2012 | -- | $12,900 | $0 | $0 |
Source: Public Records
Map
Nearby Homes
- 1212 Crawford St
- 1228 Leland St
- 1234 Huron St
- 1310 Huron St
- 1418 Blueberry Ln
- 1416 Blackberry Ln
- 1410 Berrywood Ln
- 1028 Campbell St
- 1015 Alvord Ave
- 1329 Huron St
- 1318 Ingleside Ave
- 1102 W Atherton Rd
- 1225 Waldman Ave
- 1607 Mulberry Ln
- 1314 Pinehurst Ave
- 1031 Ingleside Ave
- 1122 Markham St
- 1101 Lincoln Ave
- 1902 Crestbrook Ln
- 1039 Markham St
- 4125 Tuxedo Ave
- 4113 Tuxedo Ave
- 1114 Alvord Ave
- 1117 Crawford St Unit Bldg-Unit
- 1117 Crawford St
- 4101 Tuxedo Ave
- 1113 Crawford St
- 4118 Tuxedo Ave
- 4122 Tuxedo Ave
- 1106 Alvord Ave
- 4110 Tuxedo Ave
- 4126 Tuxedo Ave
- 4102 Tuxedo Ave
- 1125 Alvord Ave
- 1103 Crawford St
- 1102 Alvord Ave
- 1117 Alvord Ave
- 1044 Alvord Ave
- 1109 Alvord Ave
- 1201 Alvord Ave