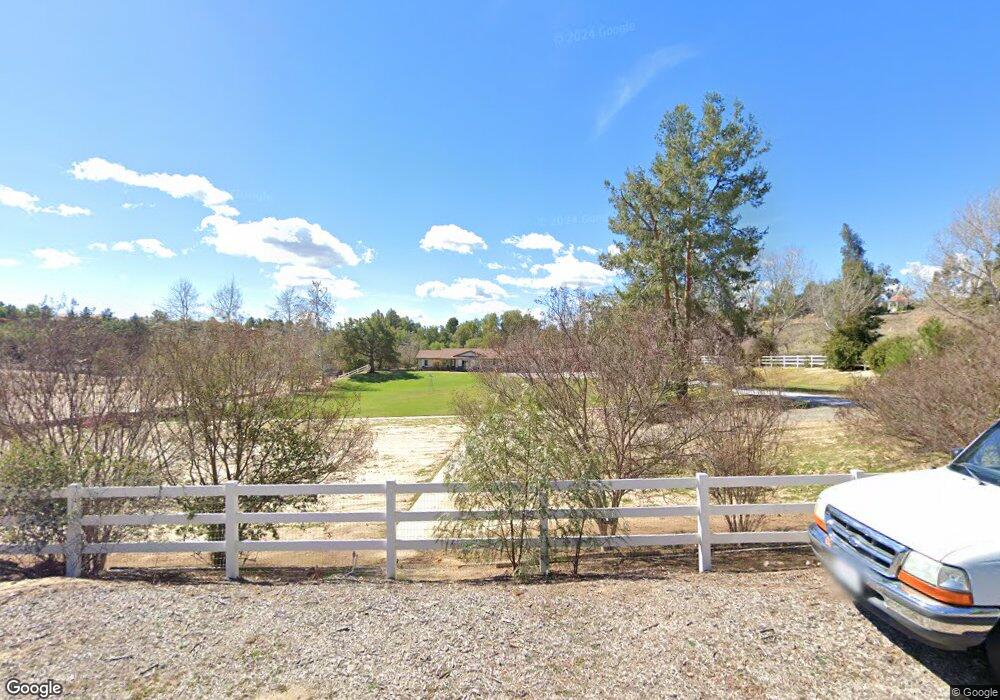
41171 Mesa Robles Cir Temecula, CA 92592
Estimated Value: $1,174,321 - $1,250,000
3
Beds
2
Baths
1,997
Sq Ft
$603/Sq Ft
Est. Value
About This Home
This home is located at 41171 Mesa Robles Cir, Temecula, CA 92592 and is currently estimated at $1,204,580, approximately $603 per square foot. 41171 Mesa Robles Cir is a home located in Riverside County with nearby schools including Crowne Hill Elementary School, Temecula Middle School, and Temecula Valley High School.
Ownership History
Date
Name
Owned For
Owner Type
Purchase Details
Closed on
May 2, 2022
Sold by
Young and Ingrid
Bought by
Bruce Young And Ingrid Young Living Trust
Current Estimated Value
Purchase Details
Closed on
Sep 11, 2003
Sold by
Devers Jack Heiple and Devers Blanche Butler
Bought by
Young Bruce and Young Ingrid
Home Financials for this Owner
Home Financials are based on the most recent Mortgage that was taken out on this home.
Original Mortgage
$445,000
Interest Rate
5.9%
Mortgage Type
Purchase Money Mortgage
Purchase Details
Closed on
Jul 8, 2002
Sold by
Devers Jack Heiple and Devers Blanche Butler
Bought by
Devers Jack Heiple and Devers Blanche Butler
Purchase Details
Closed on
Sep 30, 1998
Sold by
Heiple Devers Jack and Butle Devers Blanche
Bought by
The Jack Heiple & Blanche Butler Devers
Create a Home Valuation Report for This Property
The Home Valuation Report is an in-depth analysis detailing your home's value as well as a comparison with similar homes in the area
Purchase History
| Date | Buyer | Sale Price | Title Company |
|---|---|---|---|
| Bruce Young And Ingrid Young Living Trust | -- | None Listed On Document | |
| Young Bruce | $580,000 | Fntic | |
| Devers Jack Heiple | -- | -- | |
| The Jack Heiple & Blanche Butler Devers | -- | -- |
Source: Public Records
Mortgage History
| Date | Status | Borrower | Loan Amount |
|---|---|---|---|
| Previous Owner | Young Bruce | $445,000 |
Source: Public Records
Tax History
| Year | Tax Paid | Tax Assessment Tax Assessment Total Assessment is a certain percentage of the fair market value that is determined by local assessors to be the total taxable value of land and additions on the property. | Land | Improvement |
|---|---|---|---|---|
| 2025 | $8,776 | $767,741 | $334,109 | $433,632 |
| 2023 | $8,776 | $737,931 | $321,136 | $416,795 |
| 2022 | $8,521 | $723,463 | $314,840 | $408,623 |
| 2021 | $8,355 | $709,278 | $308,667 | $400,611 |
| 2020 | $8,270 | $702,006 | $305,502 | $396,504 |
| 2019 | $8,147 | $688,242 | $299,512 | $388,730 |
| 2018 | $7,996 | $674,748 | $293,640 | $381,108 |
| 2017 | $7,855 | $661,519 | $287,883 | $373,636 |
| 2016 | $7,694 | $648,549 | $282,239 | $366,310 |
| 2015 | $7,557 | $638,808 | $278,000 | $360,808 |
| 2014 | $6,488 | $553,000 | $241,000 | $312,000 |
Source: Public Records
Map
Nearby Homes
- 0 Pauba Rd Unit OC25223195
- 32856 Northshire Cir
- 42351 Gronlund Ct
- 42545 Lyles Dr
- 41570 Avenida Bordeaux
- 38100 Pauba Rd
- 42912 Beamer Ct
- 41300 Berkswell Ln
- 32179 Cala Torrente
- 32163 Cala Torrente
- 0 Green Tree Rd Unit 178 250037799
- 32249 Chemin Laurent
- 41284 Promenade Chardonnay Hills
- 33192 Vermont Rd
- 31852 Corte Montecito
- 41309 Avenida Biona
- 33905 Pauba Rd
- 32274 Corte Illora
- 32284 Placer Belair
- 31903 Vineyard Ave
- 33150 Pauba Rd
- 41101 Mesa Robles Cir
- 41870 Butterfield Stage Rd
- 41162 Mesa Robles Cir
- 41960 Butterfield Stage Rd
- 33100 Pauba Rd
- 32976 Northshire Cir
- 32968 Northshire Cir
- 0 Pauba Rd Unit SW18230035
- 0 Pauba Rd Unit SW18167850
- 0 Pauba Rd Unit SW18162075
- 0 Pauba Rd Unit T08026989
- 0 Pauba Rd Unit T08133337
- 0 Pauba Rd Unit T09034915
- 0 E Pauba Rd Unit T10091363
- 0 Pauba Rd Unit T10091367
- 0 Pauba Rd Unit T10091366
- 0 Pauba Rd Unit T10043971
- 0 Pauba Rd Unit T10051150
- 0 Pauba Rd Unit T10051133
Your Personal Tour Guide
Ask me questions while you tour the home.