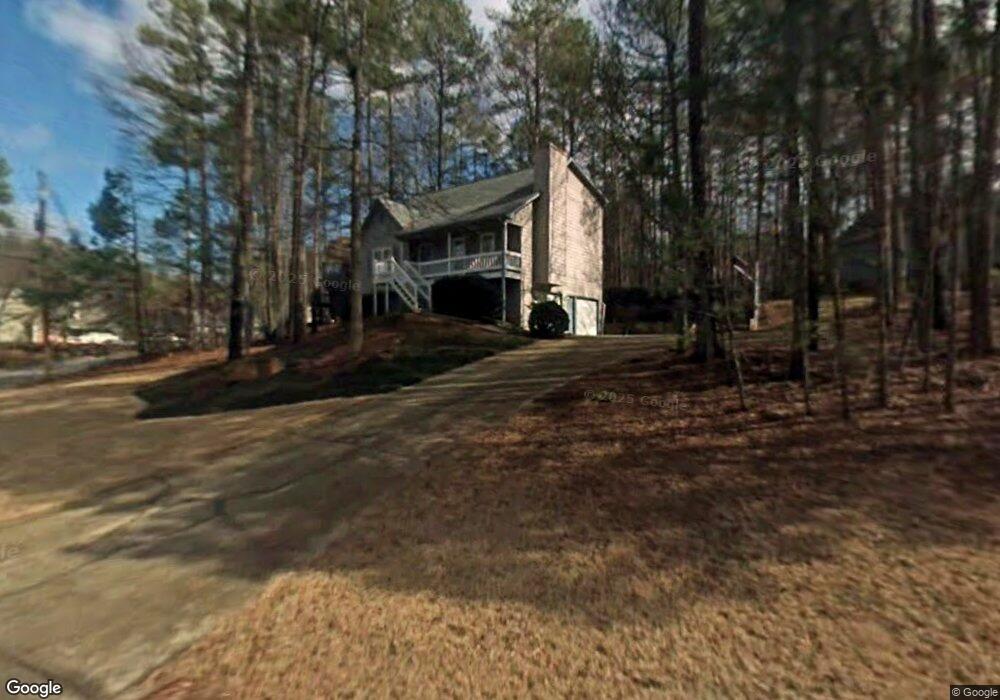
4118 Gregory Manor Cir SW Unit 3 Smyrna, GA 30082
Estimated Value: $351,124 - $372,000
3
Beds
2
Baths
1,882
Sq Ft
$194/Sq Ft
Est. Value
About This Home
This home is located at 4118 Gregory Manor Cir SW Unit 3, Smyrna, GA 30082 and is currently estimated at $365,031, approximately $193 per square foot. 4118 Gregory Manor Cir SW Unit 3 is a home located in Cobb County with nearby schools including Russell Elementary School, Floyd Middle School, and Covered Bridge Academy.
Ownership History
Date
Name
Owned For
Owner Type
Purchase Details
Closed on
Dec 30, 2005
Sold by
Davis Ricky E
Bought by
Brown Clay S
Current Estimated Value
Home Financials for this Owner
Home Financials are based on the most recent Mortgage that was taken out on this home.
Original Mortgage
$159,300
Outstanding Balance
$88,599
Interest Rate
6.19%
Mortgage Type
New Conventional
Estimated Equity
$276,432
Purchase Details
Closed on
Jul 30, 1996
Sold by
Mendez Nicasio
Bought by
Davis Rickey E
Purchase Details
Closed on
Jan 27, 1994
Sold by
Lyman Bernard M
Bought by
Mendez Nicasio
Home Financials for this Owner
Home Financials are based on the most recent Mortgage that was taken out on this home.
Original Mortgage
$84,550
Interest Rate
7.1%
Create a Home Valuation Report for This Property
The Home Valuation Report is an in-depth analysis detailing your home's value as well as a comparison with similar homes in the area
Home Values in the Area
Average Home Value in this Area
Purchase History
| Date | Buyer | Sale Price | Title Company |
|---|---|---|---|
| Brown Clay S | $177,000 | -- | |
| Davis Rickey E | $99,000 | -- | |
| Mendez Nicasio | $89,000 | -- |
Source: Public Records
Mortgage History
| Date | Status | Borrower | Loan Amount |
|---|---|---|---|
| Open | Brown Clay S | $159,300 | |
| Previous Owner | Mendez Nicasio | $84,550 | |
| Closed | Davis Rickey E | $0 |
Source: Public Records
Tax History Compared to Growth
Tax History
| Year | Tax Paid | Tax Assessment Tax Assessment Total Assessment is a certain percentage of the fair market value that is determined by local assessors to be the total taxable value of land and additions on the property. | Land | Improvement |
|---|---|---|---|---|
| 2025 | $3,475 | $148,128 | $36,000 | $112,128 |
| 2024 | $3,275 | $138,756 | $36,000 | $102,756 |
| 2023 | $2,411 | $123,932 | $22,000 | $101,932 |
| 2022 | $2,596 | $106,572 | $16,000 | $90,572 |
| 2021 | $2,340 | $94,864 | $16,000 | $78,864 |
| 2020 | $1,815 | $70,892 | $16,000 | $54,892 |
| 2019 | $1,815 | $70,892 | $16,000 | $54,892 |
| 2018 | $1,705 | $65,860 | $16,000 | $49,860 |
| 2017 | $1,621 | $65,860 | $16,000 | $49,860 |
| 2016 | $1,343 | $55,600 | $16,000 | $39,600 |
| 2015 | $1,378 | $55,600 | $16,000 | $39,600 |
| 2014 | $1,389 | $55,600 | $0 | $0 |
Source: Public Records
Map
Nearby Homes
- 620 Gregory Manor Dr SW
- 4055 Hill House Rd SW
- 585 Lawton Bridge Rd SW
- 589 Lawton Bridge Rd SW
- 4191 Alaina Cir
- 4487 S Springwood Dr SW
- 639 Concord Rd SW
- 4187 Alaina Cir Unit 18
- 4066 Covered Bridge Rd SW
- 625 Aunt Lucy (Unit 48) Ln SW
- 895 Tyrell Dr
- 347 Covered Bridge Place SW
- 3951 Covered Bridge Rd SW
- 3869 Merryweather Trail
- 637 Carlouetta Rd SW
- 3966 Covey Flush Ct SW Unit 20
- 450 Dorset Way SW
- 482 Majestic Oaks Place
- 188 Covered Bridge Trail SW
- 4116 Gregory Manor Cir SW
- 4116 Gregory Manor Cir SW
- 4120 Gregory Manor Cir SW
- 4120 Gregory Manor Cir SW
- 0 Gregory Manor Cir SW Unit 7206409
- 0 Gregory Manor Cir SW Unit 7188953
- 0 Gregory Manor Cir SW Unit 7427818
- 0 Gregory Manor Cir SW Unit 8732932
- 0 Gregory Manor Cir SW Unit 8671898
- 0 Gregory Manor Cir SW Unit 8650848
- 0 Gregory Manor Cir SW Unit 7632835
- 0 Gregory Manor Cir SW Unit 7531171
- 0 Gregory Manor Cir SW Unit 7575949
- 0 Gregory Manor Cir SW Unit 7574751
- 0 Gregory Manor Cir SW
- 4122 Gregory Manor Cir SW
- 4115 Gregory Manor Cir SW Unit 3
- 0 Gregory Manor Ct SW
- 4111 Gregory Manor Cir SW Unit 3
- 4111 Gregory Manor Cir SW