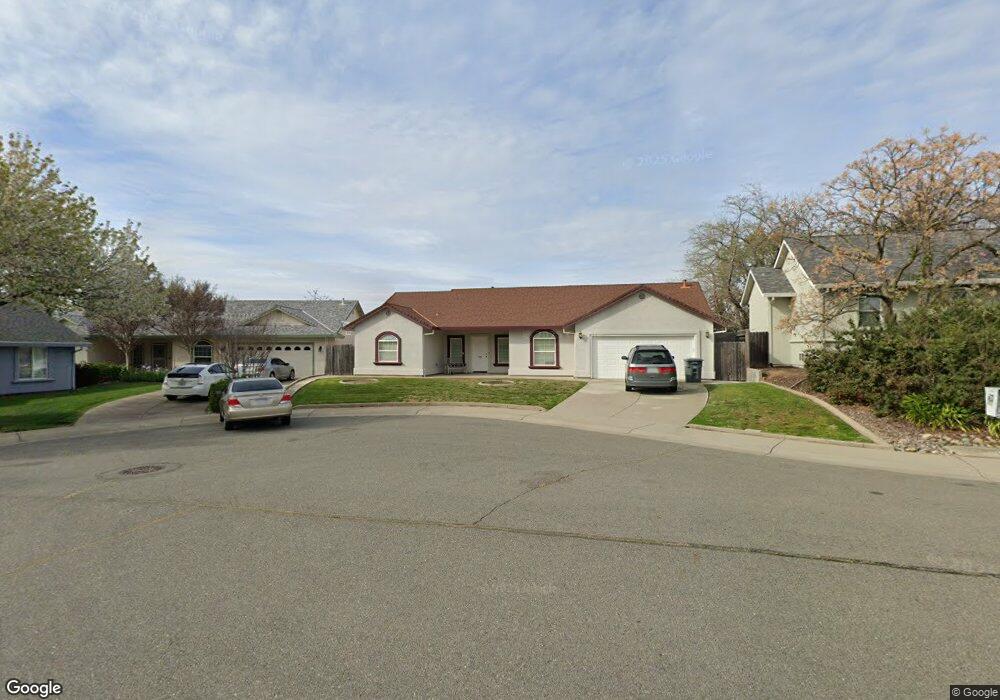
4118 Jan Ct Rocklin, CA 95677
Central Rocklin NeighborhoodEstimated Value: $446,000 - $574,000
3
Beds
2
Baths
1,625
Sq Ft
$323/Sq Ft
Est. Value
About This Home
This home is located at 4118 Jan Ct, Rocklin, CA 95677 and is currently estimated at $525,399, approximately $323 per square foot. 4118 Jan Ct is a home located in Placer County with nearby schools including Rocklin Elementary School, Spring View Middle School, and Rocklin High.
Ownership History
Date
Name
Owned For
Owner Type
Purchase Details
Closed on
Jul 9, 2004
Sold by
Martin Helen
Bought by
Martin Helen Fallon
Current Estimated Value
Purchase Details
Closed on
Mar 4, 2002
Sold by
Killingsworth Partners Inc
Bought by
Martin Helen
Home Financials for this Owner
Home Financials are based on the most recent Mortgage that was taken out on this home.
Original Mortgage
$211,500
Outstanding Balance
$87,914
Interest Rate
6.99%
Estimated Equity
$437,485
Create a Home Valuation Report for This Property
The Home Valuation Report is an in-depth analysis detailing your home's value as well as a comparison with similar homes in the area
Home Values in the Area
Average Home Value in this Area
Purchase History
| Date | Buyer | Sale Price | Title Company |
|---|---|---|---|
| Martin Helen Fallon | -- | -- | |
| Martin Helen | $235,000 | Alliance Title Company | |
| Martin Helen | -- | Alliance Title Company |
Source: Public Records
Mortgage History
| Date | Status | Borrower | Loan Amount |
|---|---|---|---|
| Open | Martin Helen | $211,500 |
Source: Public Records
Tax History Compared to Growth
Tax History
| Year | Tax Paid | Tax Assessment Tax Assessment Total Assessment is a certain percentage of the fair market value that is determined by local assessors to be the total taxable value of land and additions on the property. | Land | Improvement |
|---|---|---|---|---|
| 2025 | $3,819 | $347,138 | $96,011 | $251,127 |
| 2023 | $3,819 | $333,660 | $92,284 | $241,376 |
| 2022 | $3,697 | $327,119 | $90,475 | $236,644 |
| 2021 | $3,657 | $320,705 | $88,701 | $232,004 |
| 2020 | $3,652 | $317,418 | $87,792 | $229,626 |
| 2019 | $3,602 | $311,195 | $86,071 | $225,124 |
| 2018 | $3,510 | $305,094 | $84,384 | $220,710 |
| 2017 | $3,514 | $299,113 | $82,730 | $216,383 |
| 2016 | $3,415 | $293,249 | $81,108 | $212,141 |
| 2015 | $3,374 | $288,845 | $79,890 | $208,955 |
| 2014 | $3,176 | $271,000 | $75,000 | $196,000 |
Source: Public Records
Map
Nearby Homes
- 4010 Della Ct
- 5505 S Grove St Unit 101
- 5505 S Grove St Unit 119
- 5505 S Grove St Unit 45
- 5505 S Grove St Unit 203
- 4166 Oakmont St Unit 197
- 4137 Oakmont St
- 4184 Oakview Dr
- 5500- China Garden Rd
- 4114 Autumn Crossing Ln
- 4212 Rockwood St
- 4275 Fernwood St
- 5825 Dew Ct
- 4271 Fernwood St
- 4279 Fernwood St Unit 39
- 4261 Fernwood St Unit 33
- 5810 Elmwood Ct
- 3540 Farron St
- 4980 Meyers St
- 4410 Redstart Ln Unit Lot11