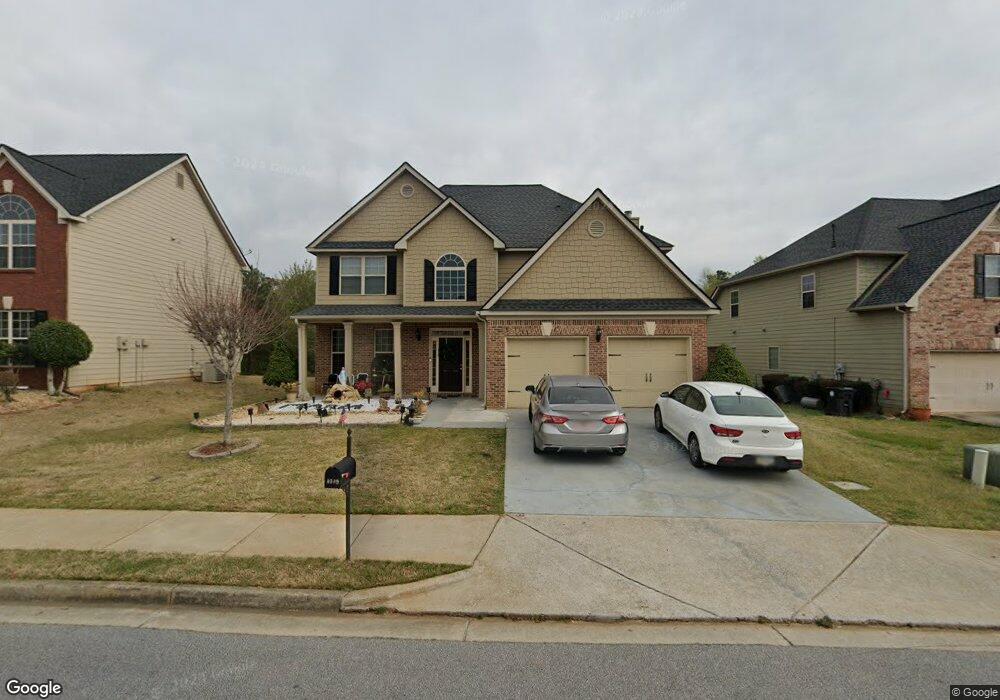
4119 Pearhaven Ln Gainesville, GA 30504
Mundy Mill NeighborhoodEstimated Value: $395,236 - $475,000
4
Beds
3
Baths
3,416
Sq Ft
$128/Sq Ft
Est. Value
About This Home
This home is located at 4119 Pearhaven Ln, Gainesville, GA 30504 and is currently estimated at $436,059, approximately $127 per square foot. 4119 Pearhaven Ln is a home located in Hall County with nearby schools including Mundy Mill Academy, Gainesville High School, and Elachee Nature Academy.
Ownership History
Date
Name
Owned For
Owner Type
Purchase Details
Closed on
Jul 8, 2025
Sold by
Nguyen Cam T
Bought by
Cao Vy T
Current Estimated Value
Home Financials for this Owner
Home Financials are based on the most recent Mortgage that was taken out on this home.
Original Mortgage
$180,000
Outstanding Balance
$179,695
Interest Rate
6.84%
Mortgage Type
New Conventional
Estimated Equity
$256,364
Purchase Details
Closed on
Sep 28, 2020
Sold by
Torres Jose Luis
Bought by
Nguyen Cam T and Cao Vy T
Home Financials for this Owner
Home Financials are based on the most recent Mortgage that was taken out on this home.
Original Mortgage
$217,200
Interest Rate
2.9%
Mortgage Type
New Conventional
Purchase Details
Closed on
Feb 2, 2012
Sold by
Oceguera Gerardo
Bought by
Torres Jose Luis
Purchase Details
Closed on
Jul 2, 2009
Sold by
Scenic Homes
Bought by
Oceguera Gerardo
Home Financials for this Owner
Home Financials are based on the most recent Mortgage that was taken out on this home.
Original Mortgage
$163,965
Interest Rate
4.88%
Mortgage Type
FHA
Purchase Details
Closed on
Mar 15, 2007
Sold by
Mundy Mill Residential Llc
Bought by
Melrose Homes Llc Dba Scenic Homes
Create a Home Valuation Report for This Property
The Home Valuation Report is an in-depth analysis detailing your home's value as well as a comparison with similar homes in the area
Home Values in the Area
Average Home Value in this Area
Purchase History
| Date | Buyer | Sale Price | Title Company |
|---|---|---|---|
| Cao Vy T | -- | -- | |
| Nguyen Cam T | $271,500 | -- | |
| Torres Jose Luis | -- | -- | |
| Oceguera Gerardo | $167,000 | -- | |
| Melrose Homes Llc Dba Scenic Homes | -- | -- |
Source: Public Records
Mortgage History
| Date | Status | Borrower | Loan Amount |
|---|---|---|---|
| Open | Cao Vy T | $180,000 | |
| Previous Owner | Nguyen Cam T | $217,200 | |
| Previous Owner | Oceguera Gerardo | $163,965 |
Source: Public Records
Tax History
| Year | Tax Paid | Tax Assessment Tax Assessment Total Assessment is a certain percentage of the fair market value that is determined by local assessors to be the total taxable value of land and additions on the property. | Land | Improvement |
|---|---|---|---|---|
| 2025 | $4,254 | $149,600 | $21,600 | $128,000 |
| 2024 | $4,061 | $141,800 | $21,600 | $120,200 |
| 2023 | $616 | $153,600 | $20,680 | $132,920 |
| 2022 | $587 | $124,600 | $21,200 | $103,400 |
| 2021 | $506 | $97,120 | $11,600 | $85,520 |
| 2020 | $2,697 | $90,080 | $9,200 | $80,880 |
| 2019 | $2,687 | $88,440 | $9,000 | $79,440 |
| 2018 | $521 | $89,840 | $10,000 | $79,840 |
| 2017 | $468 | $84,480 | $10,000 | $74,480 |
| 2016 | $2,657 | $96,560 | $10,000 | $86,560 |
| 2015 | $278 | $53,704 | $10,000 | $43,704 |
| 2014 | $278 | $47,704 | $4,000 | $43,704 |
Source: Public Records
Map
Nearby Homes
- 5292 Magnolia Place Unit 188
- 5300 Magnolia Place Unit 186
- 5287 Magonlia Grove Way Unit 179
- 5288 Magnolia Place Unit 189
- 5308 Magnolia Place Unit 184
- 4219 Box Elder Path
- 4245 Pearhaven Ln SW
- 4302 Box Elder Path
- 4405 Chestnut Oak Way SW
- 4613 Water Oak Ct SW
- 4671 Cypress Park Dr
- 4489 Mill Oak Way SW
- 4380 Rockrose Green Way
- 5303 Magnolia Grove Way Unit 183
- 5303 Magnolia Grove Way
- 5299 Magnolia Grove Way
- 5295 Magnolia Grove Way Unit 181
- Jasmine Plan at The Grove At Mundy Mill
- Jade I Plan at The Grove At Mundy Mill
- Jade II Plan at The Grove At Mundy Mill
- 4123 Pearhaven Ln
- 4115 Pearhaven Ln
- 4127 Pearhaven Ln
- 4111 Pearhaven Ln
- 4124 Pearhaven Ln
- 4120 Pear Haven Ln
- 4120 Pearhaven Ln
- 4111 Pear Haven Ln
- 4116 Pearhaven Ln
- 4104 Black Birch Run
- 4131 Pearhaven Ln
- 4107 Box Elder Path
- 4112 Black Birch Run
- 4107 Pearhaven Ln SW
- 4135 Pearhaven Ln
- 4105 Black Birch Run
- 4111 Box Elder Path
- 4120 Black Birch Run Unit 95
- 4120 Black Birch Run
- 4110 Box Elder Path
Your Personal Tour Guide
Ask me questions while you tour the home.