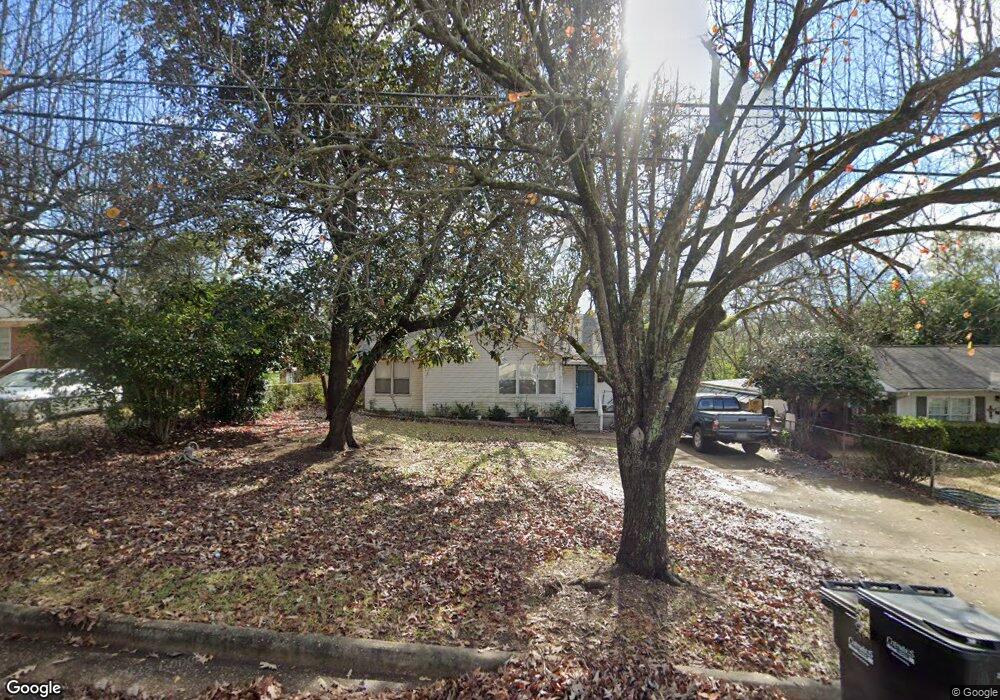
412 48th St Columbus, GA 31904
North Columbus NeighborhoodEstimated Value: $100,000 - $125,000
3
Beds
2
Baths
1,167
Sq Ft
$99/Sq Ft
Est. Value
About This Home
This home is located at 412 48th St, Columbus, GA 31904 and is currently estimated at $115,398, approximately $98 per square foot. 412 48th St is a home located in Muscogee County with nearby schools including River Road Elementary School, Double Churches Middle School, and Jordan Vocational High School.
Ownership History
Date
Name
Owned For
Owner Type
Purchase Details
Closed on
Sep 28, 2007
Sold by
Kennon Gerry L
Bought by
Evermon Danielle D and Barfield David Michael
Current Estimated Value
Home Financials for this Owner
Home Financials are based on the most recent Mortgage that was taken out on this home.
Original Mortgage
$5,000
Outstanding Balance
$3,167
Interest Rate
6.49%
Mortgage Type
Unknown
Estimated Equity
$112,231
Create a Home Valuation Report for This Property
The Home Valuation Report is an in-depth analysis detailing your home's value as well as a comparison with similar homes in the area
Home Values in the Area
Average Home Value in this Area
Purchase History
| Date | Buyer | Sale Price | Title Company |
|---|---|---|---|
| Evermon Danielle D | $92,000 | -- | |
| Evermon Danielle D | $92,000 | None Available |
Source: Public Records
Mortgage History
| Date | Status | Borrower | Loan Amount |
|---|---|---|---|
| Open | Evermon Danielle D | $5,000 | |
| Open | Evermon Danielle D | $89,320 | |
| Closed | Evermon Danielle D | $5,000 |
Source: Public Records
Tax History
| Year | Tax Paid | Tax Assessment Tax Assessment Total Assessment is a certain percentage of the fair market value that is determined by local assessors to be the total taxable value of land and additions on the property. | Land | Improvement |
|---|---|---|---|---|
| 2025 | $922 | $35,392 | $9,372 | $26,020 |
| 2024 | $921 | $35,392 | $9,372 | $26,020 |
| 2023 | $233 | $35,392 | $9,372 | $26,020 |
| 2022 | $960 | $26,968 | $7,028 | $19,940 |
| 2021 | $953 | $25,504 | $7,028 | $18,476 |
| 2020 | $954 | $25,504 | $7,028 | $18,476 |
| 2019 | $959 | $25,504 | $7,028 | $18,476 |
| 2018 | $959 | $25,504 | $7,028 | $18,476 |
| 2017 | $963 | $25,504 | $7,028 | $18,476 |
| 2016 | $968 | $36,743 | $2,640 | $34,103 |
| 2015 | $970 | $36,743 | $2,640 | $34,103 |
| 2014 | $972 | $36,743 | $2,640 | $34,103 |
| 2013 | -- | $36,743 | $2,640 | $34,103 |
Source: Public Records
Map
Nearby Homes
Your Personal Tour Guide
Ask me questions while you tour the home.