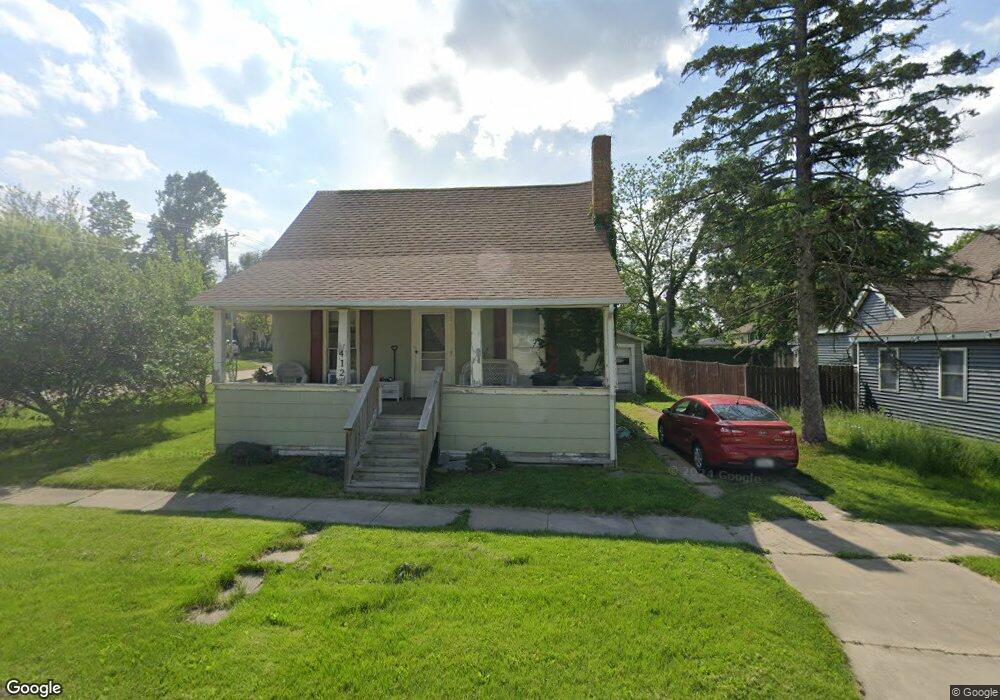
412 7th St Marion, IA 52302
Estimated Value: $95,000 - $158,000
2
Beds
2
Baths
1,136
Sq Ft
$109/Sq Ft
Est. Value
About This Home
This home is located at 412 7th St, Marion, IA 52302 and is currently estimated at $123,763, approximately $108 per square foot. 412 7th St is a home located in Linn County with nearby schools including Starry Elementary School, Francis Marion Intermediate School, and Vernon Middle School.
Ownership History
Date
Name
Owned For
Owner Type
Purchase Details
Closed on
Dec 12, 2022
Sold by
Sheriff Of Linn County
Bought by
Linn Area Credit Union
Current Estimated Value
Purchase Details
Closed on
Dec 6, 2022
Sold by
Sheriff Of Linn County
Bought by
Linn Area Credit Union and Smiley
Purchase Details
Closed on
Jan 13, 2005
Sold by
Jp Morgan Chase Bank
Bought by
Campbell Barbara R
Home Financials for this Owner
Home Financials are based on the most recent Mortgage that was taken out on this home.
Original Mortgage
$40,755
Interest Rate
5.88%
Mortgage Type
Fannie Mae Freddie Mac
Purchase Details
Closed on
May 11, 2004
Sold by
Yeisley Erin L
Bought by
Jp Morgan Chase Bank
Purchase Details
Closed on
Apr 30, 2002
Sold by
Ferment George R and Ferment Barbara T
Bought by
Yeisley Erin L
Home Financials for this Owner
Home Financials are based on the most recent Mortgage that was taken out on this home.
Original Mortgage
$49,550
Interest Rate
11.62%
Create a Home Valuation Report for This Property
The Home Valuation Report is an in-depth analysis detailing your home's value as well as a comparison with similar homes in the area
Home Values in the Area
Average Home Value in this Area
Purchase History
| Date | Buyer | Sale Price | Title Company |
|---|---|---|---|
| Linn Area Credit Union | $90,328 | -- | |
| Linn Area Credit Union | $90,328 | None Listed On Document | |
| Campbell Barbara R | $42,500 | -- | |
| Jp Morgan Chase Bank | $54,391 | -- | |
| Yeisley Erin L | $42,500 | -- |
Source: Public Records
Mortgage History
| Date | Status | Borrower | Loan Amount |
|---|---|---|---|
| Previous Owner | Campbell Barbara R | $40,755 | |
| Previous Owner | Yeisley Erin L | $49,550 |
Source: Public Records
Tax History Compared to Growth
Tax History
| Year | Tax Paid | Tax Assessment Tax Assessment Total Assessment is a certain percentage of the fair market value that is determined by local assessors to be the total taxable value of land and additions on the property. | Land | Improvement |
|---|---|---|---|---|
| 2025 | $1,820 | $105,300 | $14,200 | $91,100 |
| 2024 | $1,654 | $97,000 | $14,200 | $82,800 |
| 2023 | $1,654 | $97,000 | $14,200 | $82,800 |
| 2022 | $1,598 | $74,300 | $14,200 | $60,100 |
| 2021 | $1,538 | $74,300 | $14,200 | $60,100 |
| 2020 | $1,538 | $68,000 | $14,200 | $53,800 |
| 2019 | $1,578 | $70,000 | $17,300 | $52,700 |
| 2018 | $1,330 | $70,000 | $17,300 | $52,700 |
| 2017 | $1,382 | $61,200 | $18,900 | $42,300 |
| 2016 | $1,362 | $61,200 | $18,900 | $42,300 |
| 2015 | $1,356 | $61,200 | $18,900 | $42,300 |
| 2014 | $1,356 | $61,200 | $18,900 | $42,300 |
| 2013 | $1,304 | $61,200 | $18,900 | $42,300 |
Source: Public Records
Map
Nearby Homes