412 Center St Unit 14 Elgin, IL 60120
Northeast Elgin NeighborhoodEstimated Value: $170,000 - $235,068
3
Beds
2
Baths
817
Sq Ft
$240/Sq Ft
Est. Value
About This Home
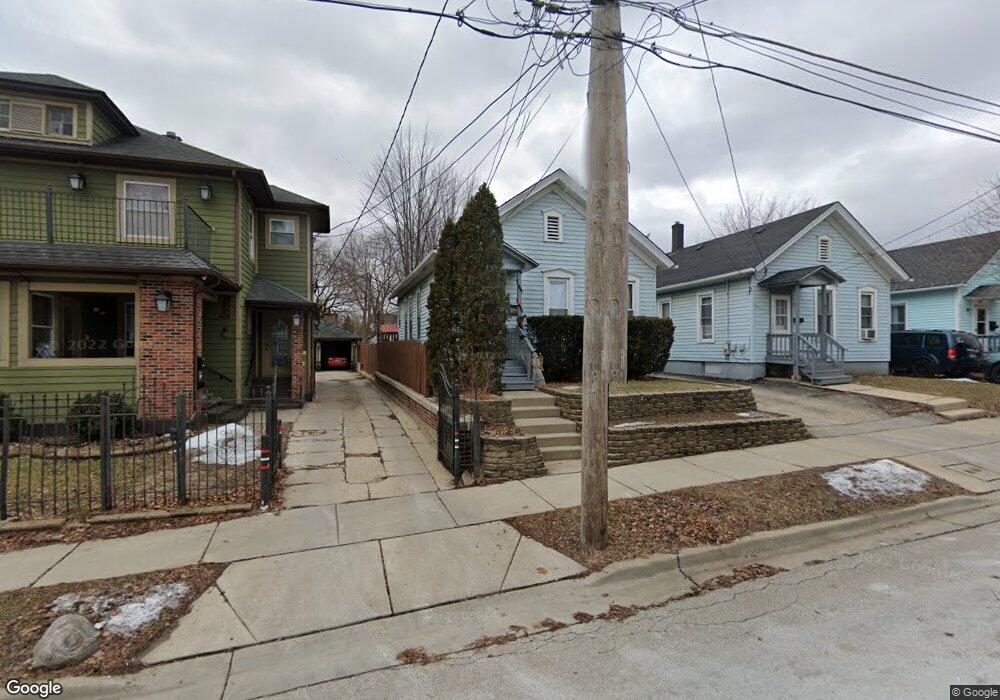
This home is located at 412 Center St Unit 14, Elgin, IL 60120 and is currently estimated at $196,017, approximately $239 per square foot. 412 Center St Unit 14 is a home located in Kane County with nearby schools including Ronald D O'Neal Elementary School, Kimball Middle School, and Larkin High School.
Ownership History
Date
Name
Owned For
Owner Type
Purchase Details
Closed on
Feb 9, 2021
Sold by
Sanchez Leonor F
Bought by
Sanchez Leonor F and Ascencio Alejandro
Current Estimated Value
Purchase Details
Closed on
Feb 16, 2010
Sold by
Pnc Bank National Association
Bought by
Sanchez Leonor F
Purchase Details
Closed on
Apr 23, 2009
Sold by
Federal Home Loan Mortgage Corporation
Bought by
National City Real Estate Services Llc and National City Mortgage Inc
Purchase Details
Closed on
Jul 18, 2008
Sold by
Ochoa Enrique L
Bought by
Federal Home Loan Mortgage Corporation
Purchase Details
Closed on
Mar 15, 2005
Sold by
Zavala Jose L and Zavala Maria
Bought by
Ochoa Enrique L
Home Financials for this Owner
Home Financials are based on the most recent Mortgage that was taken out on this home.
Original Mortgage
$206,550
Interest Rate
5.61%
Mortgage Type
Purchase Money Mortgage
Create a Home Valuation Report for This Property
The Home Valuation Report is an in-depth analysis detailing your home's value as well as a comparison with similar homes in the area
Home Values in the Area
Average Home Value in this Area
Purchase History
| Date | Buyer | Sale Price | Title Company |
|---|---|---|---|
| Sanchez Leonor F | -- | Attorney | |
| Sanchez Leonor F | $71,000 | Attorneys Title Guaranty Fun | |
| National City Real Estate Services Llc | -- | Attorneys Title Guaranty Fun | |
| Federal Home Loan Mortgage Corporation | -- | None Available | |
| Ochoa Enrique L | $229,500 | -- |
Source: Public Records
Mortgage History
| Date | Status | Borrower | Loan Amount |
|---|---|---|---|
| Previous Owner | Ochoa Enrique L | $206,550 |
Source: Public Records
Tax History
| Year | Tax Paid | Tax Assessment Tax Assessment Total Assessment is a certain percentage of the fair market value that is determined by local assessors to be the total taxable value of land and additions on the property. | Land | Improvement |
|---|---|---|---|---|
| 2024 | $5,948 | $74,327 | $15,691 | $58,636 |
| 2023 | $5,724 | $67,149 | $14,176 | $52,973 |
| 2022 | $5,309 | $61,228 | $12,926 | $48,302 |
| 2021 | $5,107 | $57,244 | $12,085 | $45,159 |
| 2020 | $4,984 | $54,648 | $11,537 | $43,111 |
| 2019 | $4,862 | $52,056 | $10,990 | $41,066 |
| 2018 | $4,848 | $49,040 | $10,353 | $38,687 |
| 2017 | $4,768 | $46,360 | $9,787 | $36,573 |
| 2016 | $4,587 | $43,010 | $9,080 | $33,930 |
| 2015 | -- | $39,423 | $8,323 | $31,100 |
| 2014 | -- | $38,936 | $8,220 | $30,716 |
| 2013 | -- | $39,963 | $8,437 | $31,526 |
Source: Public Records
Map
Nearby Homes
- 464 Prospect St
- 603 Douglas Ave
- 363 Franklin Blvd
- 268 N Gifford St
- 409 Algona Ave
- 371 North St
- 131 N Gifford St
- 453 Addison St
- 841 Douglas Ave
- 58 S Geneva St
- 920 Augusta Ave
- 643 Wing St
- 211 Prairie St
- 115 N Porter St
- 9 N Jackson St
- 601 Columbia Ave
- 162 Festival Ct
- 96 S Crystal St
- 705 W Highland Ave
- 336 Hamilton Ave
- 412-14 Center St
- 418 Center St Unit 20
- 408 Center St
- 400 Center St
- 211 Seneca St
- 415 Center St Unit 17
- 407 Center St
- 423 Center St
- 210 Cherry St
- 405 Center St
- 415 N Spring St Unit 17
- 419 N Spring St Unit 21
- 224 Seneca St
- 409 N Spring St
- 218 Seneca St
- 263 Seneca St
- 216 Seneca St
- 262 Cherry St
- 403 N Spring St
- 212 Seneca St
Your Personal Tour Guide
Ask me questions while you tour the home.