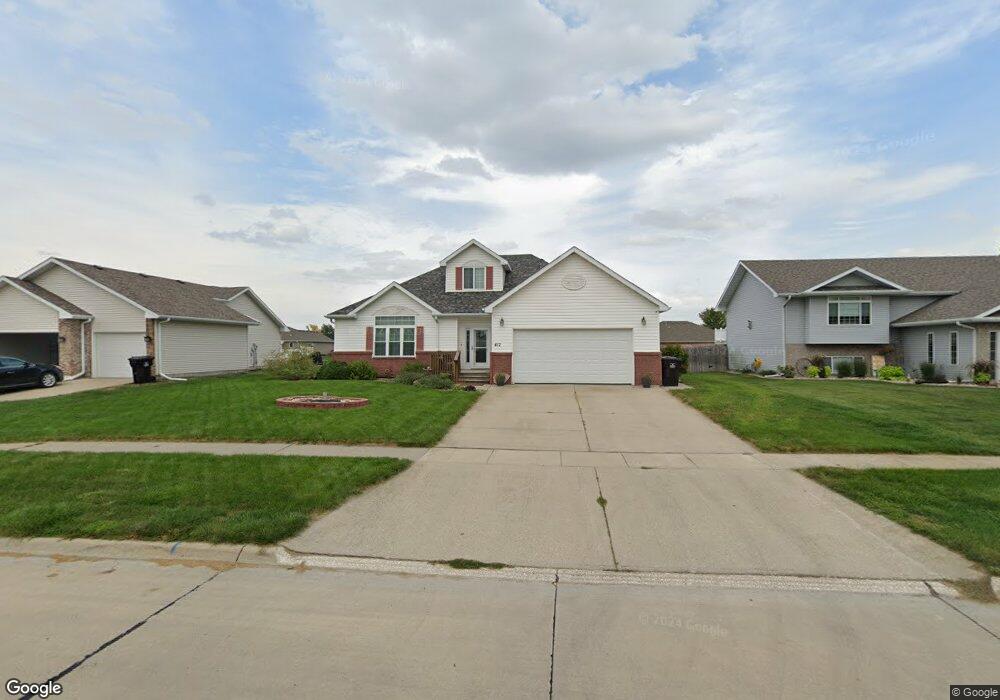
412 Coniston Cir Sergeant Bluff, IA 51054
Estimated Value: $386,809 - $464,000
5
Beds
4
Baths
2,333
Sq Ft
$181/Sq Ft
Est. Value
About This Home
This home is located at 412 Coniston Cir, Sergeant Bluff, IA 51054 and is currently estimated at $422,452, approximately $181 per square foot. 412 Coniston Cir is a home located in Woodbury County with nearby schools including Sergeant Bluff-Luton Primary School, Sergeant Bluff-Luton Elementary School, and Sergeant Bluff-Luton Middle School.
Ownership History
Date
Name
Owned For
Owner Type
Purchase Details
Closed on
Nov 15, 2005
Sold by
Corey Nicholas G and Corey Carol J
Bought by
Jansen Christopher P and Jansen Dejah M
Current Estimated Value
Home Financials for this Owner
Home Financials are based on the most recent Mortgage that was taken out on this home.
Original Mortgage
$202,450
Outstanding Balance
$110,926
Interest Rate
6.04%
Mortgage Type
New Conventional
Estimated Equity
$311,526
Purchase Details
Closed on
Jan 10, 2005
Sold by
Dakota County State Bank
Bought by
Corey Nicholas G
Home Financials for this Owner
Home Financials are based on the most recent Mortgage that was taken out on this home.
Original Mortgage
$133,000
Interest Rate
7%
Mortgage Type
Adjustable Rate Mortgage/ARM
Create a Home Valuation Report for This Property
The Home Valuation Report is an in-depth analysis detailing your home's value as well as a comparison with similar homes in the area
Home Values in the Area
Average Home Value in this Area
Purchase History
| Date | Buyer | Sale Price | Title Company |
|---|---|---|---|
| Jansen Christopher P | $225,000 | None Available | |
| Corey Nicholas G | $51,500 | None Available |
Source: Public Records
Mortgage History
| Date | Status | Borrower | Loan Amount |
|---|---|---|---|
| Open | Jansen Christopher P | $202,450 | |
| Previous Owner | Corey Nicholas G | $133,000 |
Source: Public Records
Tax History
| Year | Tax Paid | Tax Assessment Tax Assessment Total Assessment is a certain percentage of the fair market value that is determined by local assessors to be the total taxable value of land and additions on the property. | Land | Improvement |
|---|---|---|---|---|
| 2025 | $5,596 | $401,450 | $44,000 | $357,450 |
| 2024 | $54 | $373,030 | $35,700 | $337,330 |
| 2023 | $5,534 | $373,030 | $35,700 | $337,330 |
| 2022 | $5,332 | $323,860 | $35,700 | $288,160 |
| 2021 | $5,332 | $315,010 | $35,700 | $279,310 |
| 2020 | $4,892 | $284,280 | $38,200 | $246,080 |
| 2019 | $4,966 | $284,280 | $38,200 | $246,080 |
| 2018 | $4,796 | $284,280 | $38,200 | $246,080 |
| 2017 | $4,796 | $281,570 | $38,200 | $243,370 |
| 2016 | $5,300 | $281,570 | $0 | $0 |
| 2015 | $4,929 | $263,150 | $35,700 | $227,450 |
| 2014 | $4,651 | $246,730 | $35,700 | $211,030 |
Source: Public Records
Map
Nearby Homes
- 414 Coniston Cir
- 410 Coniston Cir
- 408 Coniston Cir
- 416 Coniston Cir
- 413 Coniston Cir
- 411 Coniston Cir
- 205 Windsor Way
- 207 Windsor Way
- 203 Windsor Way
- 415 Coniston Cir
- 201 Windsor Way
- 209 Windsor Way
- 418 Coniston Cir
- 409 Coniston Cir
- 407 Coniston Cir
- 401 Coniston Cir
- 419 Coniston Cir
- 420 Coniston Cir
- 211 Windsor Way
- 103 Windsor Way
Your Personal Tour Guide
Ask me questions while you tour the home.