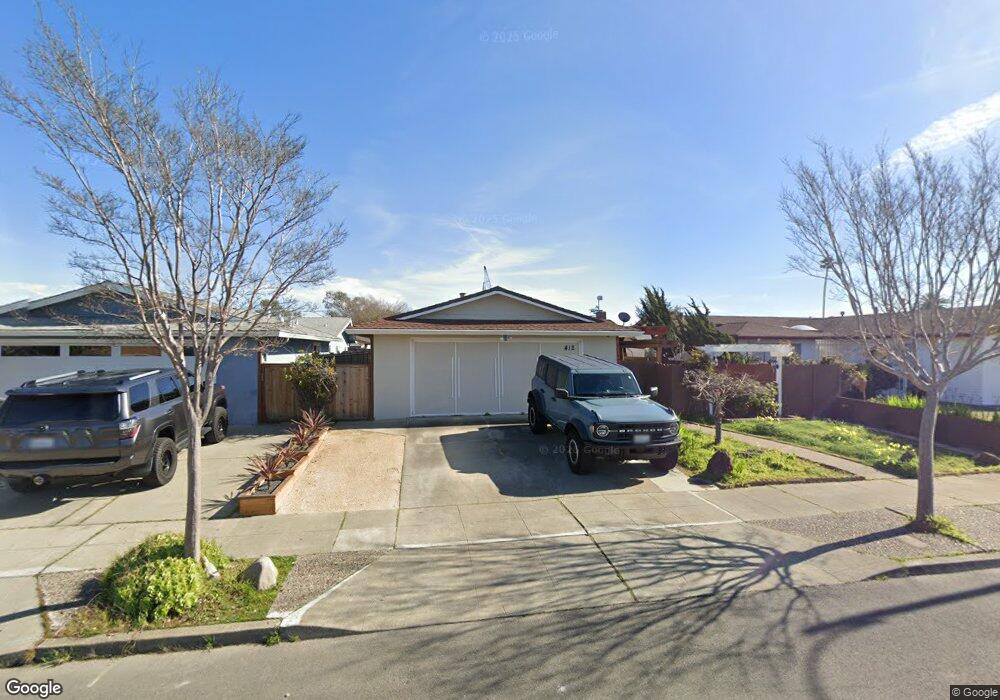
412 Coral Reef Rd Alameda, CA 94501
South Shore NeighborhoodEstimated Value: $1,106,000 - $1,234,000
3
Beds
2
Baths
1,243
Sq Ft
$932/Sq Ft
Est. Value
About This Home
This home is located at 412 Coral Reef Rd, Alameda, CA 94501 and is currently estimated at $1,159,089, approximately $932 per square foot. 412 Coral Reef Rd is a home located in Alameda County with nearby schools including William G. Paden Elementary School, Will C. Wood Middle School, and Encinal Junior/Senior High.
Ownership History
Date
Name
Owned For
Owner Type
Purchase Details
Closed on
Jun 19, 2019
Sold by
Reyes Richard and Reyes Edgar B
Bought by
Zhang Zhong and Sun Wei
Current Estimated Value
Purchase Details
Closed on
Sep 19, 2005
Sold by
Reyes Michelle K Alioto
Bought by
Reyes Richard
Home Financials for this Owner
Home Financials are based on the most recent Mortgage that was taken out on this home.
Original Mortgage
$445,000
Interest Rate
6.3%
Mortgage Type
Negative Amortization
Purchase Details
Closed on
Jan 3, 2005
Sold by
Reyes Edgar B
Bought by
Reyes Richard and Reyes Edgar
Purchase Details
Closed on
Jun 1, 1998
Sold by
Ferrero Romeo and Ferrero Fred B
Bought by
Reyes Edgar B
Home Financials for this Owner
Home Financials are based on the most recent Mortgage that was taken out on this home.
Original Mortgage
$207,200
Interest Rate
7.1%
Create a Home Valuation Report for This Property
The Home Valuation Report is an in-depth analysis detailing your home's value as well as a comparison with similar homes in the area
Home Values in the Area
Average Home Value in this Area
Purchase History
| Date | Buyer | Sale Price | Title Company |
|---|---|---|---|
| Zhang Zhong | $988,000 | Chicago Title Company | |
| Reyes Edgar B | -- | Chicago Title Company | |
| Reyes Richard | -- | Alliance Title Company | |
| Reyes Edgar | -- | Alliance Title Company | |
| Reyes Richard | -- | -- | |
| Reyes Edgar B | $259,000 | Old Republic Title Company |
Source: Public Records
Mortgage History
| Date | Status | Borrower | Loan Amount |
|---|---|---|---|
| Previous Owner | Reyes Edgar | $445,000 | |
| Previous Owner | Reyes Edgar B | $207,200 |
Source: Public Records
Tax History
| Year | Tax Paid | Tax Assessment Tax Assessment Total Assessment is a certain percentage of the fair market value that is determined by local assessors to be the total taxable value of land and additions on the property. | Land | Improvement |
|---|---|---|---|---|
| 2025 | $14,996 | $1,102,114 | $446,200 | $655,914 |
| 2024 | $14,996 | $1,080,506 | $437,452 | $643,054 |
| 2023 | $14,396 | $1,059,323 | $428,876 | $630,447 |
| 2022 | $14,063 | $1,038,555 | $420,468 | $618,087 |
| 2021 | $13,702 | $1,018,193 | $412,224 | $605,969 |
| 2020 | $13,531 | $1,007,760 | $408,000 | $599,760 |
| 2019 | $5,716 | $370,718 | $111,215 | $259,503 |
| 2018 | $8,486 | $363,451 | $109,035 | $254,416 |
| 2017 | $8,249 | $356,326 | $106,898 | $249,428 |
| 2016 | $8,243 | $349,341 | $104,802 | $244,539 |
| 2015 | $5,314 | $344,094 | $103,228 | $240,866 |
| 2014 | $5,091 | $337,354 | $101,206 | $236,148 |
Source: Public Records
Map
Nearby Homes
- 955 Shorepoint Ct Unit 216
- 960 Shorepoint Ct Unit 215
- 933 Shoreline Dr Unit 203
- 1122 Bay St
- 325 Kitty Hawk Rd Unit 207
- 1822 Clinton Ave
- 2000 Clinton Ave
- 2031 Otis Dr Unit H
- 610 Grand St
- 1203 Benton St
- 1211 Paru St
- 2106 Otis Dr Unit A
- 1500 Alameda Ave Unit G
- 1000 Central Ave
- 2101 Shoreline Dr Unit 153
- 2101 Shoreline Dr Unit 475
- 1401 Cottage St Unit D
- 2137 Otis Dr Unit 111
- 1512 Mozart St
- 1523 Verdi St
- 408 Coral Reef Rd
- 416 Coral Reef Rd
- 420 Coral Reef Rd
- 413 Sunset Rd
- 417 Sunset Rd
- 409 Sunset Rd
- 421 Sunset Rd
- 405 Sunset Rd
- 424 Coral Reef Rd
- 400 Coral Reef Rd
- 413 Coral Reef Rd
- 417 Coral Reef Rd
- 409 Coral Reef Rd
- 425 Sunset Rd
- 401 Sunset Rd
- 421 Coral Reef Rd
- 405 Coral Reef Rd
- 328 Coral Reef Rd
- 428 Coral Reef Rd
- 425 Coral Reef Rd
Your Personal Tour Guide
Ask me questions while you tour the home.