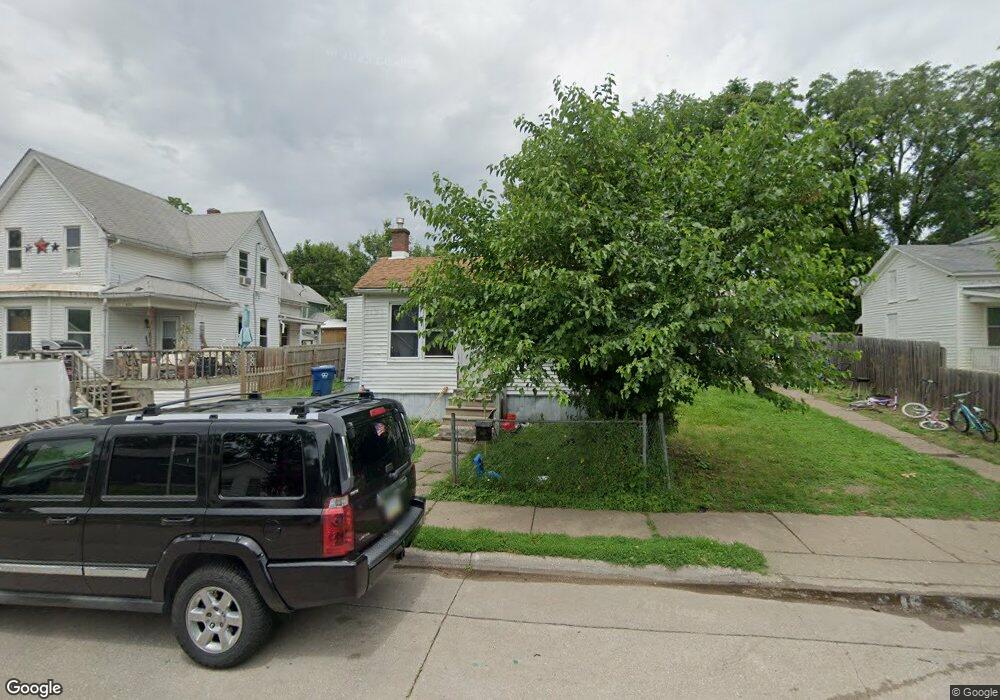
412 E 9th St Davenport, IA 52803
Central Davenport NeighborhoodEstimated Value: $70,000 - $82,511
2
Beds
1
Bath
1,008
Sq Ft
$78/Sq Ft
Est. Value
About This Home
This home is located at 412 E 9th St, Davenport, IA 52803 and is currently estimated at $78,128, approximately $77 per square foot. 412 E 9th St is a home located in Scott County with nearby schools including Madison Elementary School, Frank L. Smart Intermediate School, and Central High School.
Ownership History
Date
Name
Owned For
Owner Type
Purchase Details
Closed on
Aug 7, 2009
Sold by
Federal National Mortgage Association
Bought by
Island Properties Llc
Current Estimated Value
Purchase Details
Closed on
Jan 21, 2005
Sold by
Hammes Jesse and Hammes Kelly J
Bought by
Dreher Tena M
Home Financials for this Owner
Home Financials are based on the most recent Mortgage that was taken out on this home.
Original Mortgage
$42,300
Interest Rate
5.77%
Mortgage Type
Credit Line Revolving
Create a Home Valuation Report for This Property
The Home Valuation Report is an in-depth analysis detailing your home's value as well as a comparison with similar homes in the area
Home Values in the Area
Average Home Value in this Area
Purchase History
| Date | Buyer | Sale Price | Title Company |
|---|---|---|---|
| Island Properties Llc | -- | None Available | |
| Dreher Tena M | $47,000 | None Available |
Source: Public Records
Mortgage History
| Date | Status | Borrower | Loan Amount |
|---|---|---|---|
| Previous Owner | Dreher Tena M | $42,300 |
Source: Public Records
Tax History
| Year | Tax Paid | Tax Assessment Tax Assessment Total Assessment is a certain percentage of the fair market value that is determined by local assessors to be the total taxable value of land and additions on the property. | Land | Improvement |
|---|---|---|---|---|
| 2025 | $986 | $55,170 | $14,000 | $41,170 |
| 2024 | $962 | $55,170 | $14,000 | $41,170 |
| 2023 | $878 | $55,170 | $14,000 | $41,170 |
| 2022 | $852 | $41,100 | $6,400 | $34,700 |
| 2021 | $852 | $39,750 | $6,400 | $33,350 |
| 2020 | $848 | $35,200 | $6,400 | $28,800 |
| 2019 | $1,460 | $35,200 | $6,400 | $28,800 |
| 2018 | $1,048 | $35,200 | $6,400 | $28,800 |
| 2017 | $1,567 | $33,690 | $6,400 | $27,290 |
| 2016 | $738 | $33,690 | $0 | $0 |
| 2015 | $738 | $36,110 | $0 | $0 |
| 2014 | $802 | $36,110 | $0 | $0 |
| 2013 | $788 | $0 | $0 | $0 |
| 2012 | -- | $44,950 | $6,030 | $38,920 |
Source: Public Records
Map
Nearby Homes
- 418 E 8th St
- 919 Leclaire St
- 715 Iowa St
- 928 Farnam St
- 3 Riverview Place
- 707 N Brady St
- 705 Brady St
- 1012 Arlington Ave
- 209 E 13th St
- 1108 Arlington Ave
- 818 Charlotte St
- 1136 Arlington Ave
- 1320 Grand Ave
- 320 E 14th St
- 1134 Tremont Ave
- 133 W 13th St
- 803 E River Dr
- 1429 Brady St
- 325 Kirkwood Blvd
- 1422 Arlington Ave
Your Personal Tour Guide
Ask me questions while you tour the home.