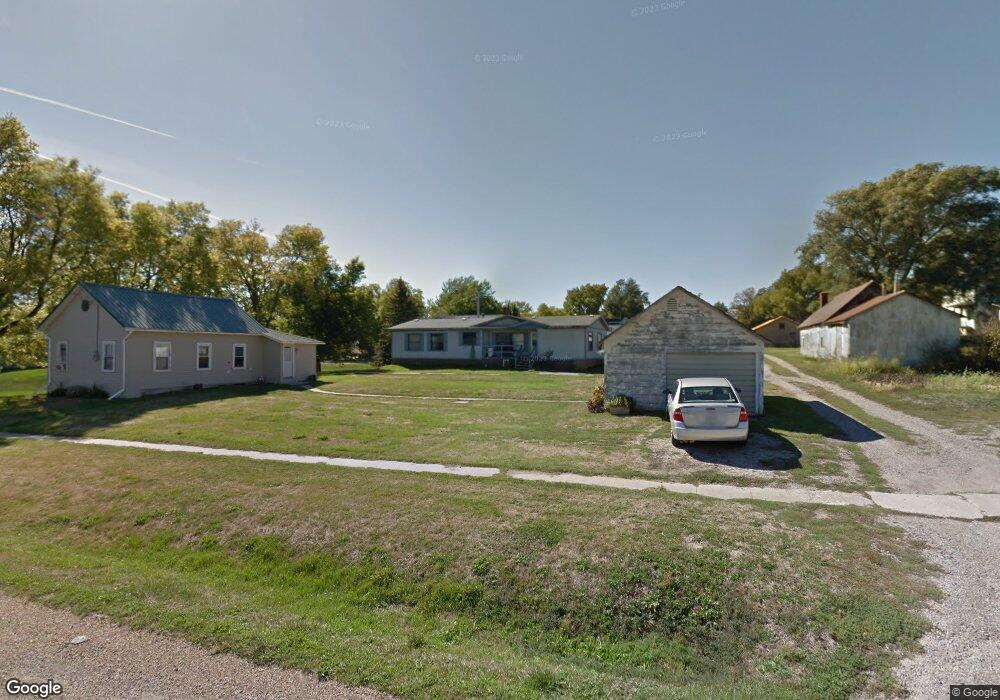
412 E Main St Brooklyn, IA 52211
Estimated Value: $60,000 - $141,000
3
Beds
4
Baths
1,508
Sq Ft
$65/Sq Ft
Est. Value
About This Home
This home is located at 412 E Main St, Brooklyn, IA 52211 and is currently estimated at $97,802, approximately $64 per square foot. 412 E Main St is a home with nearby schools including Brooklyn-Guernsey-Malcom Elementary School and Brooklyn-Guernsey-Malcom Junior/Senior High School.
Ownership History
Date
Name
Owned For
Owner Type
Purchase Details
Closed on
Nov 2, 2020
Sold by
Manatt Brian L and Manatt Laura
Bought by
Kalinay Craig and Kalinay Jill
Current Estimated Value
Home Financials for this Owner
Home Financials are based on the most recent Mortgage that was taken out on this home.
Original Mortgage
$233,200
Outstanding Balance
$207,419
Interest Rate
2.9%
Mortgage Type
New Conventional
Estimated Equity
-$109,617
Purchase Details
Closed on
Oct 20, 2016
Sold by
Wells Fargo Bank Na
Bought by
Nikolish Jacqueline and Nikolish Slavia
Purchase Details
Closed on
Sep 2, 2007
Sold by
Ridel Kristina Kay and Loschen Kristina Kay
Bought by
Garringer Matthew B and Brown Garringer Shannon M
Home Financials for this Owner
Home Financials are based on the most recent Mortgage that was taken out on this home.
Original Mortgage
$65,374
Interest Rate
6.63%
Mortgage Type
FHA
Create a Home Valuation Report for This Property
The Home Valuation Report is an in-depth analysis detailing your home's value as well as a comparison with similar homes in the area
Purchase History
| Date | Buyer | Sale Price | Title Company |
|---|---|---|---|
| Kalinay Craig | $275,000 | None Available | |
| Nikolish Jacqueline | $31,300 | None Available | |
| Garringer Matthew B | $66,500 | None Available |
Source: Public Records
Mortgage History
| Date | Status | Borrower | Loan Amount |
|---|---|---|---|
| Open | Kalinay Craig | $233,200 | |
| Previous Owner | Garringer Matthew B | $65,374 |
Source: Public Records
Tax History
| Year | Tax Paid | Tax Assessment Tax Assessment Total Assessment is a certain percentage of the fair market value that is determined by local assessors to be the total taxable value of land and additions on the property. | Land | Improvement |
|---|---|---|---|---|
| 2025 | $956 | $64,590 | $12,690 | $51,900 |
| 2024 | $1,212 | $58,510 | $11,280 | $47,230 |
| 2023 | $816 | $58,510 | $11,280 | $47,230 |
| 2022 | $778 | $42,210 | $8,970 | $33,240 |
| 2021 | $778 | $39,820 | $8,460 | $31,360 |
| 2020 | $810 | $39,820 | $8,460 | $31,360 |
| 2019 | $868 | $42,280 | $8,460 | $33,820 |
| 2018 | $888 | $42,280 | $8,460 | $33,820 |
| 2017 | $914 | $42,280 | $8,460 | $33,820 |
| 2016 | $858 | $42,280 | $8,460 | $33,820 |
| 2015 | $858 | $42,280 | $8,460 | $33,820 |
| 2014 | $836 | $42,280 | $8,460 | $33,820 |
Source: Public Records
Map
Nearby Homes
- 611 Broadway St
- 505 E Des Moines St
- 508 Williams St
- 404 W Des Moines St
- 511 N Orchard St
- 505 W Pershing Dr
- 515 W Des Moines St
- 528 W Pershing Dr
- 215 Brady St
- 4182 160th St
- 1251 Holiday Ln
- 1246 E Ridge Dr
- 1139 E Ridge Dr
- 1332 Holiday Ln
- 1126 Lakeshore Dr
- 6214 Lakeshore Dr
- 1275 Holiday Ln
- 1275 Holiday Ln Unit 1
- 2141 S Lake Shore Dr
- 4038 Phelps Dr
- 416 E Main St
- 408 E Main St
- 716 Mills St
- 403 E Des Moines St
- 411 E Des Moines St
- 506 E Main St
- 503 E Des Moines St
- 507 E Main St
- 508 E Main St
- 317 E Des Moines St
- 509 E Des Moines St
- 509 E Main St
- 410 E Des Moines St
- 510 E Main St
- 416 E Des Moines St
- 404 E Des Moines St
- 612 Williams St
- 311 E Des Moines St
- 608 Williams St
- 307 E Des Moines St
Your Personal Tour Guide
Ask me questions while you tour the home.