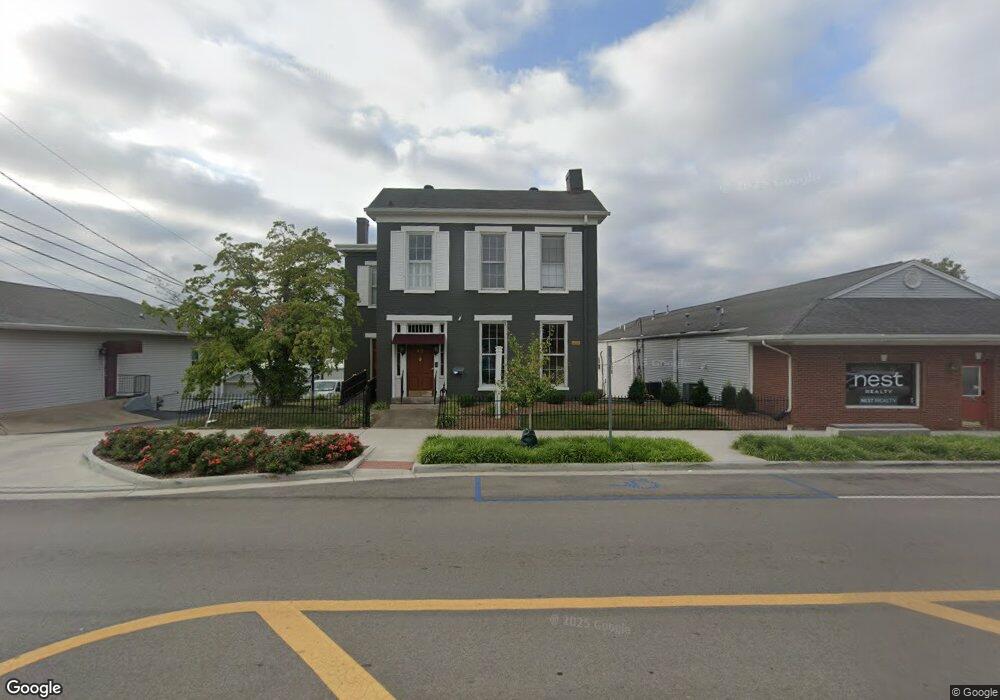
412 E Main St New Albany, IN 47150
Estimated Value: $210,000 - $443,000
--
Bed
3
Baths
1,300
Sq Ft
$252/Sq Ft
Est. Value
About This Home
This home is located at 412 E Main St, New Albany, IN 47150 and is currently estimated at $327,208, approximately $251 per square foot. 412 E Main St is a home located in Floyd County with nearby schools including S. Ellen Jones Elementary School, Nathaniel Scribner Middle School, and New Albany Senior High School.
Ownership History
Date
Name
Owned For
Owner Type
Purchase Details
Closed on
May 5, 2023
Sold by
Smd Llc
Bought by
Dowell Lemor M and Dowell Rosalie G
Current Estimated Value
Purchase Details
Closed on
Apr 26, 2023
Sold by
Cdf Llc
Bought by
Dowell Lemor M and Dowell Rosalie G
Purchase Details
Closed on
Sep 22, 2022
Sold by
Cdf Llc
Bought by
Smd Llc
Create a Home Valuation Report for This Property
The Home Valuation Report is an in-depth analysis detailing your home's value as well as a comparison with similar homes in the area
Home Values in the Area
Average Home Value in this Area
Purchase History
| Date | Buyer | Sale Price | Title Company |
|---|---|---|---|
| Dowell Lemor M | -- | None Listed On Document | |
| Dowell Lemor M | -- | None Listed On Document | |
| Smd Llc | -- | -- |
Source: Public Records
Tax History Compared to Growth
Tax History
| Year | Tax Paid | Tax Assessment Tax Assessment Total Assessment is a certain percentage of the fair market value that is determined by local assessors to be the total taxable value of land and additions on the property. | Land | Improvement |
|---|---|---|---|---|
| 2024 | $4,650 | $165,500 | $40,500 | $125,000 |
| 2023 | $7,360 | $168,400 | $40,500 | $127,900 |
| 2022 | $4,963 | $171,200 | $40,500 | $130,700 |
| 2021 | $4,688 | $160,900 | $40,500 | $120,400 |
| 2020 | $4,574 | $160,900 | $40,500 | $120,400 |
| 2019 | $4,429 | $160,900 | $40,500 | $120,400 |
| 2018 | $4,386 | $159,700 | $40,500 | $119,200 |
| 2017 | $4,450 | $159,500 | $40,500 | $119,000 |
| 2016 | $4,088 | $158,100 | $40,500 | $117,600 |
| 2014 | $4,605 | $162,800 | $40,500 | $122,300 |
| 2013 | -- | $158,800 | $40,500 | $118,300 |
Source: Public Records
Map
Nearby Homes
- 323 E 9th St
- 1010 E Spring St
- 416 E 11th St
- 1119 Ekin Ave
- 335 E 15th St
- 1205 Ekin Ave
- 1313 Culbertson Ave
- 1314 Ekin Ave
- 330 E 16th St
- 336 E 16th St
- 613 W Market St
- 1617 King St
- 1120 Chartres St
- 1619 King St
- 830 Cedar Bough Place
- 605 W 6th St
- 3931 Northwestern Pkwy
- 220 W 8th St
- 608 E Oak St
- 1605 Culbertson Ave