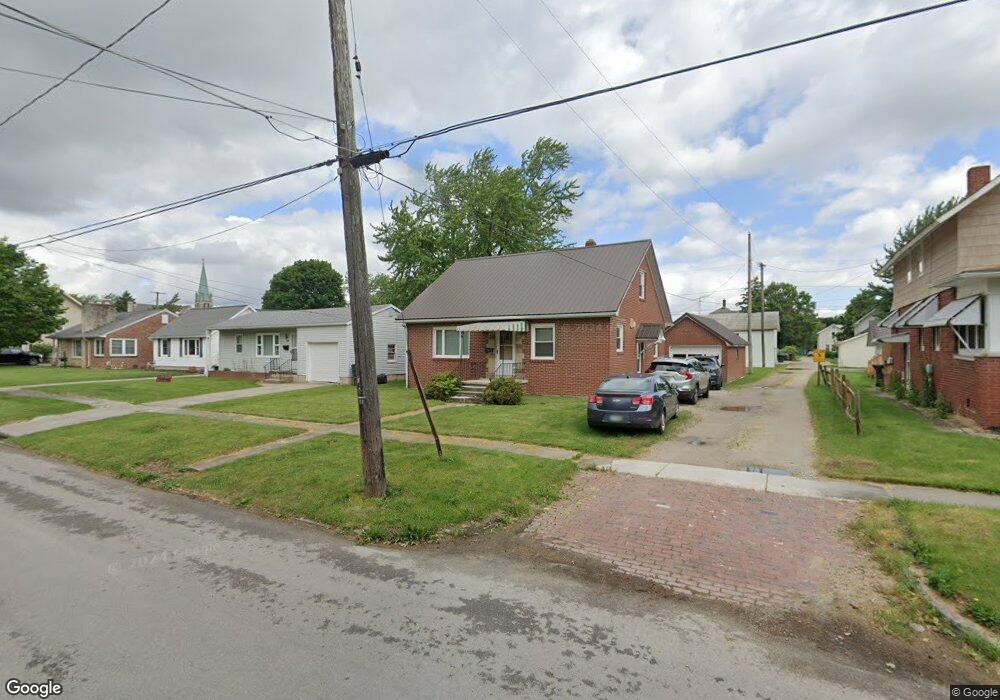
412 E Yeasting St Gibsonburg, OH 43431
Estimated Value: $150,000 - $179,000
3
Beds
2
Baths
1,421
Sq Ft
$120/Sq Ft
Est. Value
About This Home
This home is located at 412 E Yeasting St, Gibsonburg, OH 43431 and is currently estimated at $170,378, approximately $119 per square foot. 412 E Yeasting St is a home located in Sandusky County with nearby schools including James J. Hilfiker Elementary School, Gibsonburg Middle School, and Gibsonburg High School.
Ownership History
Date
Name
Owned For
Owner Type
Purchase Details
Closed on
Dec 22, 2014
Sold by
Johnston Sandra L
Bought by
Turner Patrick L and Turner Jean A
Current Estimated Value
Purchase Details
Closed on
Nov 25, 2014
Sold by
Johnston Sandra L and Johnston Donald R
Bought by
Turner Patrick L and Turner Jean A
Purchase Details
Closed on
Feb 23, 2001
Sold by
Kleinhans Andrew M
Bought by
Johnston Donald R Sandra L
Home Financials for this Owner
Home Financials are based on the most recent Mortgage that was taken out on this home.
Original Mortgage
$86,317
Interest Rate
6.91%
Mortgage Type
New Conventional
Purchase Details
Closed on
Mar 17, 2000
Sold by
Driftmyer Carl D
Bought by
Kleinhans Andrew M
Home Financials for this Owner
Home Financials are based on the most recent Mortgage that was taken out on this home.
Original Mortgage
$75,900
Interest Rate
6.75%
Mortgage Type
New Conventional
Purchase Details
Closed on
Feb 21, 1995
Sold by
Driftmyer Paul H
Bought by
Driftmyer Carl D and Driftmyer Richard T
Create a Home Valuation Report for This Property
The Home Valuation Report is an in-depth analysis detailing your home's value as well as a comparison with similar homes in the area
Home Values in the Area
Average Home Value in this Area
Purchase History
| Date | Buyer | Sale Price | Title Company |
|---|---|---|---|
| Turner Patrick L | $40,000 | None Available | |
| Turner Patrick L | -- | Attorney | |
| Johnston Donald R Sandra L | $84,000 | -- | |
| Kleinhans Andrew M | $79,900 | -- | |
| Driftmyer Carl D | $60,000 | -- |
Source: Public Records
Mortgage History
| Date | Status | Borrower | Loan Amount |
|---|---|---|---|
| Previous Owner | Johnston Donald R Sandra L | $86,317 | |
| Previous Owner | Kleinhans Andrew M | $75,900 |
Source: Public Records
Tax History Compared to Growth
Tax History
| Year | Tax Paid | Tax Assessment Tax Assessment Total Assessment is a certain percentage of the fair market value that is determined by local assessors to be the total taxable value of land and additions on the property. | Land | Improvement |
|---|---|---|---|---|
| 2024 | $1,610 | $46,550 | $6,160 | $40,390 |
| 2023 | $1,610 | $39,760 | $5,250 | $34,510 |
| 2022 | $1,486 | $39,760 | $5,250 | $34,510 |
| 2021 | $1,570 | $39,760 | $5,250 | $34,510 |
| 2020 | $1,470 | $35,390 | $5,250 | $30,140 |
| 2019 | $1,469 | $35,390 | $5,250 | $30,140 |
| 2018 | $1,471 | $35,390 | $5,250 | $30,140 |
| 2017 | $1,374 | $33,950 | $5,250 | $28,700 |
| 2016 | $1,355 | $33,950 | $5,250 | $28,700 |
| 2015 | $1,336 | $33,950 | $5,250 | $28,700 |
| 2014 | $1,882 | $36,370 | $5,250 | $31,120 |
| 2013 | $2,918 | $36,370 | $5,250 | $31,120 |
Source: Public Records
Map
Nearby Homes
- 305 E Stevenson St
- 335 Windsor Ln
- 650 E Stevenson St
- 305 S Main St
- 608 S Main St
- 433 W Stevenson St
- 500 S Patterson St
- 506 W Linden Ave
- 550 Southview Ct
- 0 Dannick Ln
- 818 S Ludwig Ave
- 830 Dannick Ln
- 1936 County Road 32
- 227 Main St
- 230 Main St
- 1337 County Road 26
- 0 County Road 90
- 712 Lueke Ave Unit 572 p
- 712 Lueke Ave
- 590 County Road 26
- 408 E Yeasting St
- 418 E Yeasting St
- 404 E Yeasting St
- 420 E Yeasting St
- 400 E Yeasting St
- 409 E Madison St
- 403 E Madison St
- 424 E Yeasting St
- 413 E Madison St
- 407 E Yeasting St
- 419 E Madison St
- 333 E Madison St
- 326 E Yeasting St
- 415 E Yeasting St
- 421 E Yeasting St
- 421 E Madison St
- 500 E Yeasting St
- 425 E Yeasting St
- 401 E Yeasting St
- 327 E Madison St