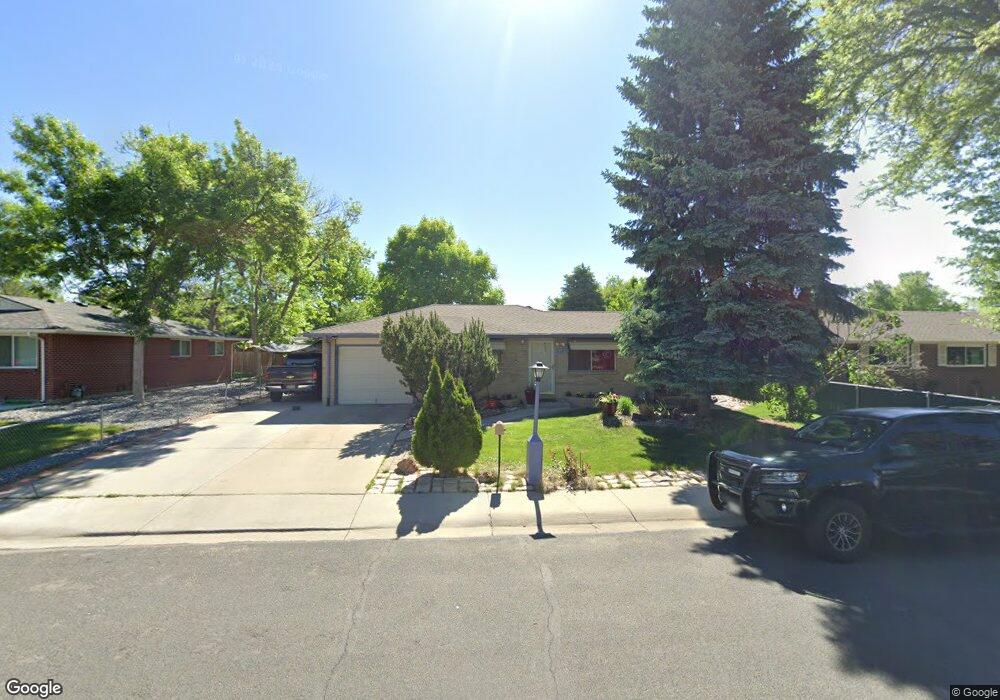
412 Elliott St Longmont, CO 80504
Kensington NeighborhoodEstimated Value: $420,918 - $438,000
3
Beds
1
Bath
1,291
Sq Ft
$335/Sq Ft
Est. Value
About This Home
This home is located at 412 Elliott St, Longmont, CO 80504 and is currently estimated at $432,480, approximately $334 per square foot. 412 Elliott St is a home located in Boulder County with nearby schools including Rocky Mountain Elementary School, Trail Ridge Middle School, and Skyline High School.
Ownership History
Date
Name
Owned For
Owner Type
Purchase Details
Closed on
Jan 25, 2002
Sold by
Mendez Mauricio
Bought by
Mendez Mauricio
Current Estimated Value
Home Financials for this Owner
Home Financials are based on the most recent Mortgage that was taken out on this home.
Original Mortgage
$142,800
Interest Rate
7.15%
Purchase Details
Closed on
Nov 30, 2000
Sold by
Ann Flores John M and Ann Mary
Bought by
Mendez Mauricio
Home Financials for this Owner
Home Financials are based on the most recent Mortgage that was taken out on this home.
Original Mortgage
$151,240
Interest Rate
7.84%
Mortgage Type
FHA
Purchase Details
Closed on
Oct 5, 1990
Bought by
Mendez Mauricio and Mendez Adalinda Nava
Purchase Details
Closed on
Oct 12, 1983
Bought by
Mendez Mauricio and Mendez Adalinda Nava
Purchase Details
Closed on
Jun 20, 1977
Bought by
Mendez Mauricio and Mendez Adalinda Nava
Create a Home Valuation Report for This Property
The Home Valuation Report is an in-depth analysis detailing your home's value as well as a comparison with similar homes in the area
Home Values in the Area
Average Home Value in this Area
Purchase History
| Date | Buyer | Sale Price | Title Company |
|---|---|---|---|
| Mendez Mauricio | -- | Land Title Guarantee Company | |
| Mendez Mauricio | -- | Land Title Guarantee Company | |
| Mendez Mauricio | $153,000 | -- | |
| Mendez Mauricio | $58,000 | -- | |
| Mendez Mauricio | $30,000 | -- | |
| Mendez Mauricio | $36,500 | -- |
Source: Public Records
Mortgage History
| Date | Status | Borrower | Loan Amount |
|---|---|---|---|
| Closed | Mendez Mauricio | $142,800 | |
| Closed | Mendez Mauricio | $151,240 |
Source: Public Records
Tax History
| Year | Tax Paid | Tax Assessment Tax Assessment Total Assessment is a certain percentage of the fair market value that is determined by local assessors to be the total taxable value of land and additions on the property. | Land | Improvement |
|---|---|---|---|---|
| 2025 | $2,141 | $24,106 | $10,256 | $13,850 |
| 2024 | $2,141 | $24,106 | $10,256 | $13,850 |
| 2023 | $2,111 | $22,378 | $11,249 | $14,814 |
| 2022 | $1,950 | $19,703 | $7,923 | $11,780 |
| 2021 | $1,975 | $20,270 | $8,151 | $12,119 |
| 2020 | $1,654 | $17,024 | $6,864 | $10,160 |
| 2019 | $1,628 | $17,024 | $6,864 | $10,160 |
| 2018 | $1,488 | $15,660 | $5,832 | $9,828 |
| 2017 | $1,467 | $17,313 | $6,448 | $10,865 |
| 2016 | $1,314 | $13,747 | $5,333 | $8,414 |
| 2015 | $1,252 | $11,255 | $3,582 | $7,673 |
| 2014 | $1,051 | $11,255 | $3,582 | $7,673 |
Source: Public Records
Map
Nearby Homes
- 727 Hubbard Dr
- 247 Wadsworth Cir
- 618 Silver Star Ct
- 524 Rider Ridge Dr
- 136 E 5th Ave
- 613 Rider Ridge Dr
- 104 Rothrock Place
- 146 E Saint Clair Ave Unit 148
- 756 Brookside Dr
- 36 Reed Place
- 225 E 8th Ave Unit E20
- 225 E 8th Ave Unit C14
- 815 Hilltop St
- 824 Elliott St
- 811 Brookside Dr
- 29 Marshall Place
- 820 Brookside Dr
- 902 Sugar Mill Ave
- 1289 Fox Hill Dr
- 1267 E 9th Ave
Your Personal Tour Guide
Ask me questions while you tour the home.