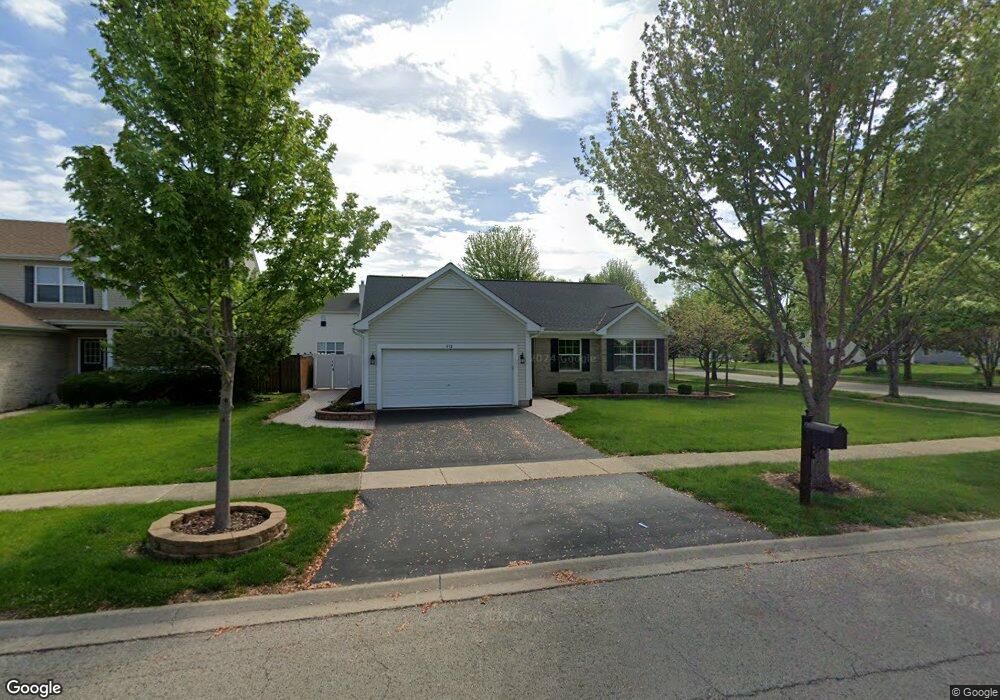
412 Grape Vine Trail Oswego, IL 60543
Northwest Oswego NeighborhoodEstimated Value: $358,302 - $376,000
3
Beds
2
Baths
1,567
Sq Ft
$233/Sq Ft
Est. Value
About This Home
This home is located at 412 Grape Vine Trail, Oswego, IL 60543 and is currently estimated at $365,326, approximately $233 per square foot. 412 Grape Vine Trail is a home located in Kendall County with nearby schools including Hunt Club Elementary School, Traughber Junior High School, and Oswego High School.
Ownership History
Date
Name
Owned For
Owner Type
Purchase Details
Closed on
May 27, 2020
Sold by
Vurgress Christine M
Bought by
The Christine M Burgress Trust
Current Estimated Value
Purchase Details
Closed on
May 21, 2014
Sold by
Burgess Leona M and Burgess Christine M
Bought by
The Leona M Burgess Declaration Of Trust
Purchase Details
Closed on
Nov 1, 2004
Sold by
Pasquinelli Blackberry Knoll Llc
Bought by
Burgess Leona M and Burgess Christine M
Home Financials for this Owner
Home Financials are based on the most recent Mortgage that was taken out on this home.
Original Mortgage
$180,100
Interest Rate
5.78%
Mortgage Type
Purchase Money Mortgage
Create a Home Valuation Report for This Property
The Home Valuation Report is an in-depth analysis detailing your home's value as well as a comparison with similar homes in the area
Home Values in the Area
Average Home Value in this Area
Purchase History
| Date | Buyer | Sale Price | Title Company |
|---|---|---|---|
| The Christine M Burgress Trust | -- | Attorney | |
| Burgess Christine M | -- | Attorney | |
| The Leona M Burgess Declaration Of Trust | -- | None Available | |
| Burgess Leona M | $228,000 | Chicago Title Insurance Co |
Source: Public Records
Mortgage History
| Date | Status | Borrower | Loan Amount |
|---|---|---|---|
| Previous Owner | Burgess Leona M | $180,100 |
Source: Public Records
Tax History
| Year | Tax Paid | Tax Assessment Tax Assessment Total Assessment is a certain percentage of the fair market value that is determined by local assessors to be the total taxable value of land and additions on the property. | Land | Improvement |
|---|---|---|---|---|
| 2024 | $4,498 | $105,494 | $13,302 | $92,192 |
| 2023 | $5,046 | $94,385 | $11,901 | $82,484 |
| 2022 | $5,046 | $85,687 | $10,804 | $74,883 |
| 2021 | $5,228 | $80,140 | $10,804 | $69,336 |
| 2020 | $5,242 | $76,215 | $10,804 | $65,411 |
| 2019 | $5,325 | $73,290 | $10,389 | $62,901 |
| 2018 | $5,486 | $69,324 | $10,389 | $58,935 |
| 2017 | $5,333 | $62,951 | $10,389 | $52,562 |
| 2016 | $4,804 | $56,904 | $10,389 | $46,515 |
| 2015 | $4,287 | $49,934 | $9,354 | $40,580 |
| 2014 | -- | $48,002 | $9,354 | $38,648 |
| 2013 | -- | $48,002 | $9,354 | $38,648 |
Source: Public Records
Map
Nearby Homes
- 424 Grape Vine Trail
- 2785 Gains Ct
- 4476 E Millbrook Cir
- 2504 Concord Ct
- 2492 Concord Ct
- 3959 Preston Dr
- 2459 Mayfield Dr
- 2455 Montclair Ln
- 530 Pineridge Dr N Unit 12
- 7619 Mill Rd
- 2717 Avalon Ln
- 19 Brookside Ln
- 2606 Seeley St
- 143 Pineridge Dr S
- 968 Sapphire Ln
- 971 Sapphire Ln
- 983 Sapphire Ln
- 984 Sapphire Ln
- 972 Sapphire Ln
- 980 Sapphire Ln
- 410 Grape Vine Trail
- 468 Grape Vine Trail
- 470 Grape Vine Trail
- 408 Grape Vine Trail
- 414 Grape Vine Trail
- 472 Grape Vine Trail
- 466 Grape Vine Trail
- 406 Grape Vine Trail
- 413 Grape Vine Trail
- 474 Grape Vine Trail
- 416 Grape Vine Trail
- 411 Grape Vine Trail
- 464 Grape Vine Trail
- 415 Grape Vine Trail
- 476 Grape Vine Trail
- 404 Grape Vine Trail
- 409 Grape Vine Trail
- 418 Grape Vine Trail
- 467 Grape Vine Trail
- 469 Grape Vine Trail
Your Personal Tour Guide
Ask me questions while you tour the home.