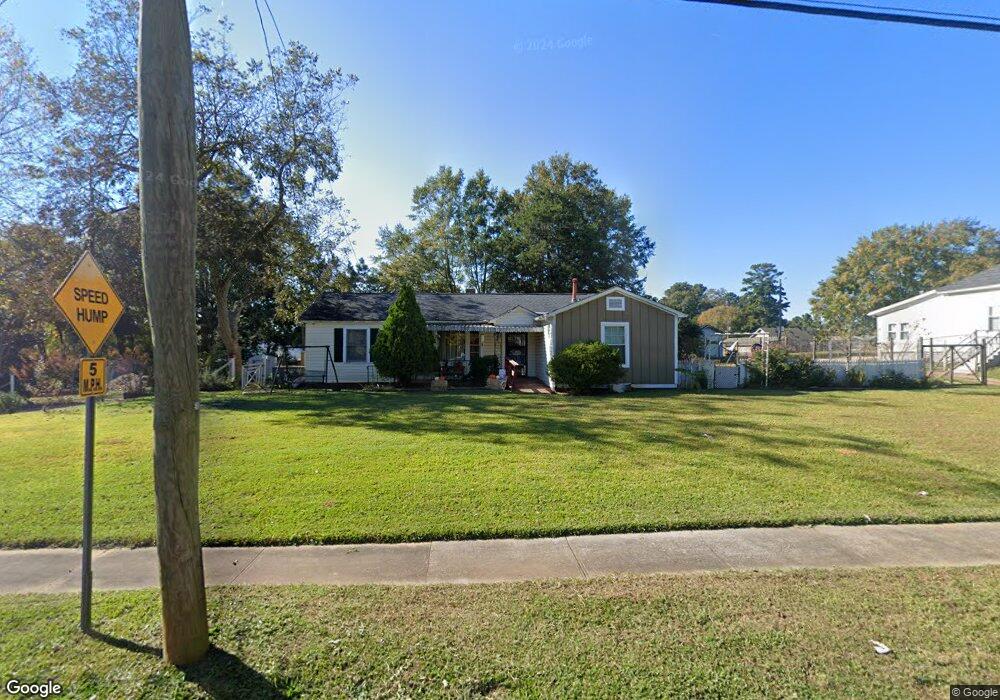
412 Jefferson St Lagrange, GA 30240
Estimated Value: $145,000 - $198,000
4
Beds
2
Baths
2,004
Sq Ft
$84/Sq Ft
Est. Value
About This Home
This home is located at 412 Jefferson St, Lagrange, GA 30240 and is currently estimated at $168,368, approximately $84 per square foot. 412 Jefferson St is a home located in Troup County with nearby schools including Ethel W. Kight Elementary School, Hollis Hand Elementary School, and Franklin Forest Elementary School.
Ownership History
Date
Name
Owned For
Owner Type
Purchase Details
Closed on
Feb 17, 2021
Sold by
Flores Anton
Bought by
Martinez Arturo and Martinez Carla
Current Estimated Value
Purchase Details
Closed on
Sep 6, 2002
Sold by
Donald F Seal
Bought by
Flores Anton and Flores Charlotte S
Purchase Details
Closed on
Dec 30, 1997
Sold by
Opal Freeman
Bought by
Donald F Seal
Purchase Details
Closed on
Mar 3, 1997
Sold by
Warren Gerald Freeman
Bought by
Opal Freeman
Purchase Details
Closed on
May 28, 1993
Sold by
Freeman Opal Larue-Life Estate
Bought by
Warren Gerald Freeman
Purchase Details
Closed on
Feb 21, 1992
Sold by
Bartlett Frances B
Bought by
Freeman Opal Larue-Life Estate
Purchase Details
Closed on
Jul 22, 1971
Sold by
Bradley Missouri J-Life Estate
Bought by
Bartlett Frances B
Purchase Details
Closed on
Nov 1, 1958
Sold by
Bartlett Frances B Etal
Bought by
Bradley Missouri J-Life Estate
Create a Home Valuation Report for This Property
The Home Valuation Report is an in-depth analysis detailing your home's value as well as a comparison with similar homes in the area
Home Values in the Area
Average Home Value in this Area
Purchase History
| Date | Buyer | Sale Price | Title Company |
|---|---|---|---|
| Martinez Arturo | -- | -- | |
| Flores Anton | $58,000 | -- | |
| Donald F Seal | $52,500 | -- | |
| Opal Freeman | -- | -- | |
| Warren Gerald Freeman | -- | -- | |
| Freeman Opal Larue-Life Estate | $51,900 | -- | |
| Bartlett Frances B | -- | -- | |
| Bradley Missouri J-Life Estate | -- | -- |
Source: Public Records
Tax History Compared to Growth
Tax History
| Year | Tax Paid | Tax Assessment Tax Assessment Total Assessment is a certain percentage of the fair market value that is determined by local assessors to be the total taxable value of land and additions on the property. | Land | Improvement |
|---|---|---|---|---|
| 2024 | $1,572 | $59,640 | $6,840 | $52,800 |
| 2023 | $772 | $48,184 | $6,840 | $41,344 |
| 2022 | $1,232 | $46,144 | $6,840 | $39,304 |
| 2021 | $1,235 | $40,960 | $6,840 | $34,120 |
| 2020 | $1,235 | $40,960 | $6,840 | $34,120 |
| 2019 | $1,148 | $38,068 | $6,840 | $31,228 |
| 2018 | $1,109 | $36,788 | $6,840 | $29,948 |
| 2017 | $1,110 | $36,788 | $6,840 | $29,948 |
| 2016 | $1,080 | $35,820 | $6,847 | $28,972 |
| 2015 | $1,250 | $41,384 | $6,847 | $34,537 |
| 2014 | $1,203 | $39,740 | $6,847 | $32,892 |
| 2013 | -- | $39,565 | $6,808 | $32,757 |
Source: Public Records
Map
Nearby Homes
- 410 Jefferson St
- 414 Jefferson St
- 408 Jefferson St
- 417 S Lee St
- 416 Jefferson St
- 419 S Lee St
- 419 S Lee St Unit 15
- 421 S Lee St
- 411 Jefferson St
- 406 Jefferson St
- 0 Jefferson St Unit 8595828
- 0 Jefferson St Unit 8464580
- 0 Jefferson St Unit 8323103
- 0 Jefferson St Unit 8716068
- 0 Jefferson St Unit 7292806
- 0 Jefferson St Unit 8605034
- 0 Jefferson St Unit 8952727
- 0 Jefferson St Unit 8980776
- 0 Jefferson St Unit 8979862
- 0 Jefferson St Unit 8247701