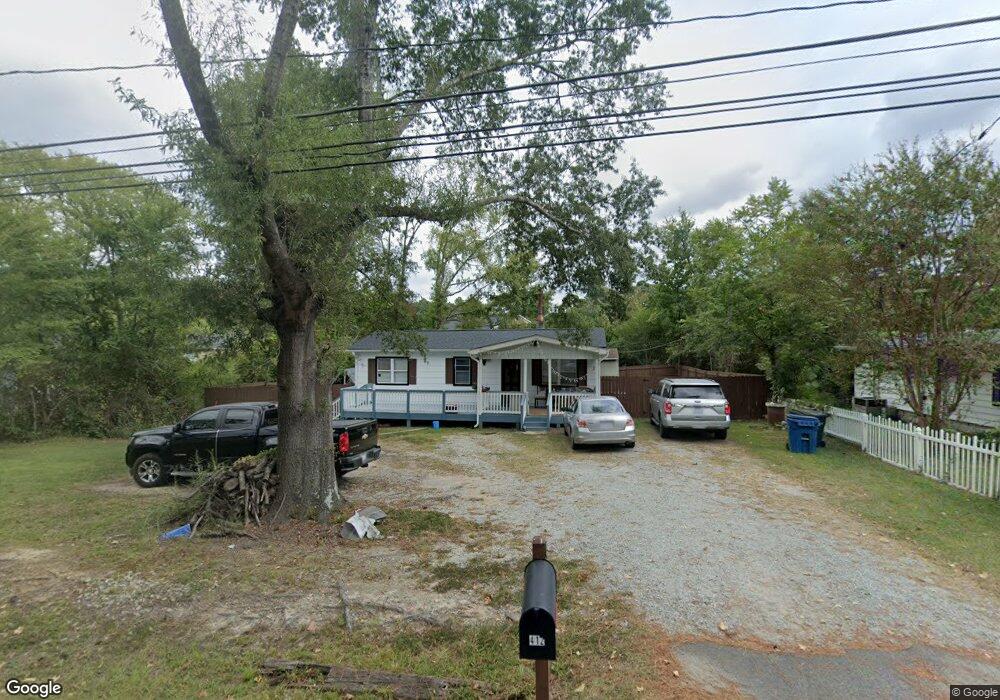
412 Junction Rd Durham, NC 27703
Eastern Durham NeighborhoodEstimated Value: $180,000 - $230,000
3
Beds
1
Bath
760
Sq Ft
$270/Sq Ft
Est. Value
About This Home
This home is located at 412 Junction Rd, Durham, NC 27703 and is currently estimated at $205,534, approximately $270 per square foot. 412 Junction Rd is a home located in Durham County with nearby schools including Merrick-Moore Elementary School, John W Neal Middle School, and Southern School of Energy & Sustainability.
Ownership History
Date
Name
Owned For
Owner Type
Purchase Details
Closed on
Nov 9, 2020
Sold by
Castillo Antonio
Bought by
Rangel Angelina
Current Estimated Value
Home Financials for this Owner
Home Financials are based on the most recent Mortgage that was taken out on this home.
Original Mortgage
$80,000
Outstanding Balance
$25,804
Interest Rate
2.9%
Mortgage Type
Commercial
Estimated Equity
$179,730
Purchase Details
Closed on
Nov 21, 2017
Sold by
Moreno Perla Jacobo and Moreno Perla Seleno Jacobo
Bought by
Castillo Antonio
Purchase Details
Closed on
Sep 20, 2012
Sold by
Fannie Mae
Bought by
Moreno Perla Jacobo
Purchase Details
Closed on
Nov 20, 2006
Sold by
Duke Jackie Ross and Buchanan Anna Rebecca
Bought by
Liles Cynthia
Home Financials for this Owner
Home Financials are based on the most recent Mortgage that was taken out on this home.
Original Mortgage
$67,000
Interest Rate
6.25%
Mortgage Type
Purchase Money Mortgage
Create a Home Valuation Report for This Property
The Home Valuation Report is an in-depth analysis detailing your home's value as well as a comparison with similar homes in the area
Home Values in the Area
Average Home Value in this Area
Purchase History
| Date | Buyer | Sale Price | Title Company |
|---|---|---|---|
| Rangel Angelina | $120,000 | None Available | |
| Castillo Antonio | -- | None Available | |
| Moreno Perla Jacobo | -- | None Available | |
| Liles Cynthia | $67,000 | None Available |
Source: Public Records
Mortgage History
| Date | Status | Borrower | Loan Amount |
|---|---|---|---|
| Open | Rangel Angelina | $80,000 | |
| Previous Owner | Liles Cynthia | $67,000 |
Source: Public Records
Tax History
| Year | Tax Paid | Tax Assessment Tax Assessment Total Assessment is a certain percentage of the fair market value that is determined by local assessors to be the total taxable value of land and additions on the property. | Land | Improvement |
|---|---|---|---|---|
| 2025 | $1,812 | $182,779 | $79,300 | $103,479 |
| 2024 | $1,200 | $85,997 | $27,517 | $58,480 |
| 2023 | $1,126 | $85,997 | $27,517 | $58,480 |
| 2022 | $1,101 | $85,997 | $27,517 | $58,480 |
| 2021 | $1,096 | $85,997 | $27,517 | $58,480 |
| 2020 | $1,070 | $85,997 | $27,517 | $58,480 |
| 2019 | $1,070 | $85,997 | $27,517 | $58,480 |
| 2018 | $884 | $65,152 | $18,345 | $46,807 |
| 2017 | $877 | $65,152 | $18,345 | $46,807 |
| 2016 | $848 | $65,152 | $18,345 | $46,807 |
| 2015 | $841 | $60,784 | $12,966 | $47,818 |
| 2014 | $841 | $60,784 | $12,966 | $47,818 |
Source: Public Records
Map
Nearby Homes
- 322 Junction Rd Unit 28h
- 3021 Worthy Way
- 2513 Rochelle St
- 212 Southerland St
- 525 N Hoover Rd
- 2750 Holloway St
- 110 N Woodcrest St
- 106 S Adams St
- 207 S Adams St
- 431 Princess Anne Dr
- 713 Heidelberg St
- 2328 Cheek Rd
- 339 Kilarney Dr
- 15 Red Sunset Ln
- 1116 Delano St
- 2015 Cheek Rd
- 3004 Cathy Dr
- 217 Fountain St
- 209 Fountain St
- 3015 Chrys St
- 416 Junction Rd
- 408 Junction Rd
- 404 Junction Rd
- 322 Junction Rd Unit 42D
- 322 Junction Rd Unit 42B
- 322 Junction Rd Unit 19D
- 322 Junction Rd Unit 18A
- 322 Junction Rd Unit 20C
- 322 Junction Rd Unit 20A
- 322 Junction Rd Unit 30C
- 322 Junction Rd Unit 15A
- 322 Junction Rd Unit 11B
- 322 Junction Rd Unit 9A
- 322 Junction Rd Unit 23D
- 322 Junction Rd
- 322 Junction Rd Unit 25E
- 322 Junction Rd
- 322 Junction Rd Unit 25C
- 322 Junction Rd Unit 25B
- 322 Junction Rd Unit 25A
Your Personal Tour Guide
Ask me questions while you tour the home.