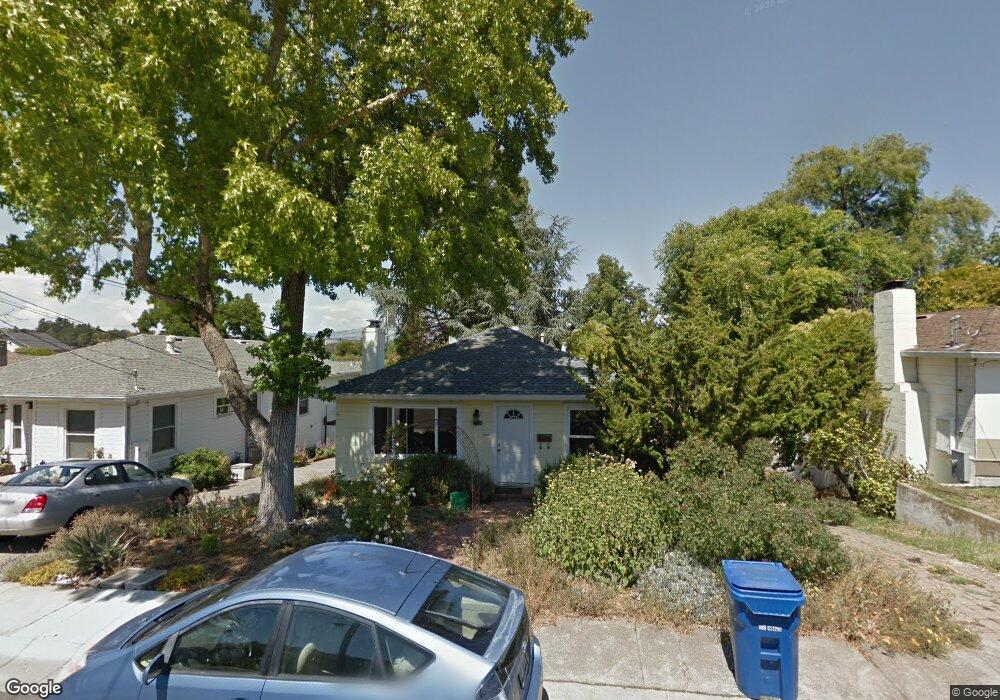
412 Melvin St Petaluma, CA 94952
Western Petaluma NeighborhoodEstimated Value: $1,027,000 - $1,163,000
3
Beds
3
Baths
1,782
Sq Ft
$609/Sq Ft
Est. Value
About This Home
This home is located at 412 Melvin St, Petaluma, CA 94952 and is currently estimated at $1,085,250, approximately $609 per square foot. 412 Melvin St is a home located in Sonoma County with nearby schools including Valley Vista Elementary School, Petaluma Junior High School, and Petaluma High School.
Ownership History
Date
Name
Owned For
Owner Type
Purchase Details
Closed on
Sep 13, 2002
Sold by
Williams D Evan
Bought by
Melov Simon L and Dodge Vanessa J
Current Estimated Value
Home Financials for this Owner
Home Financials are based on the most recent Mortgage that was taken out on this home.
Original Mortgage
$348,800
Outstanding Balance
$139,099
Interest Rate
5.62%
Estimated Equity
$946,151
Purchase Details
Closed on
Oct 26, 1995
Sold by
Barr Diana L
Bought by
Williams D Evan
Home Financials for this Owner
Home Financials are based on the most recent Mortgage that was taken out on this home.
Original Mortgage
$164,000
Interest Rate
7.58%
Create a Home Valuation Report for This Property
The Home Valuation Report is an in-depth analysis detailing your home's value as well as a comparison with similar homes in the area
Home Values in the Area
Average Home Value in this Area
Purchase History
| Date | Buyer | Sale Price | Title Company |
|---|---|---|---|
| Melov Simon L | $436,000 | Fidelity National Title Co | |
| Williams D Evan | $205,000 | First American Title |
Source: Public Records
Mortgage History
| Date | Status | Borrower | Loan Amount |
|---|---|---|---|
| Open | Melov Simon L | $348,800 | |
| Previous Owner | Williams D Evan | $164,000 | |
| Closed | Melov Simon L | $65,400 |
Source: Public Records
Tax History Compared to Growth
Tax History
| Year | Tax Paid | Tax Assessment Tax Assessment Total Assessment is a certain percentage of the fair market value that is determined by local assessors to be the total taxable value of land and additions on the property. | Land | Improvement |
|---|---|---|---|---|
| 2025 | $6,793 | $631,473 | $434,504 | $196,969 |
| 2024 | $6,793 | $619,092 | $425,985 | $193,107 |
| 2023 | $6,793 | $606,954 | $417,633 | $189,321 |
| 2022 | $6,568 | $595,054 | $409,445 | $185,609 |
| 2021 | $6,443 | $583,387 | $401,417 | $181,970 |
| 2020 | $6,498 | $577,406 | $397,301 | $180,105 |
| 2019 | $6,416 | $566,085 | $389,511 | $176,574 |
| 2018 | $6,391 | $554,986 | $381,874 | $173,112 |
| 2017 | $6,256 | $544,105 | $374,387 | $169,718 |
| 2016 | $6,107 | $533,438 | $367,047 | $166,391 |
| 2015 | $6,021 | $525,426 | $361,534 | $163,892 |
| 2014 | $5,991 | $515,135 | $354,453 | $160,682 |
Source: Public Records
Map
Nearby Homes