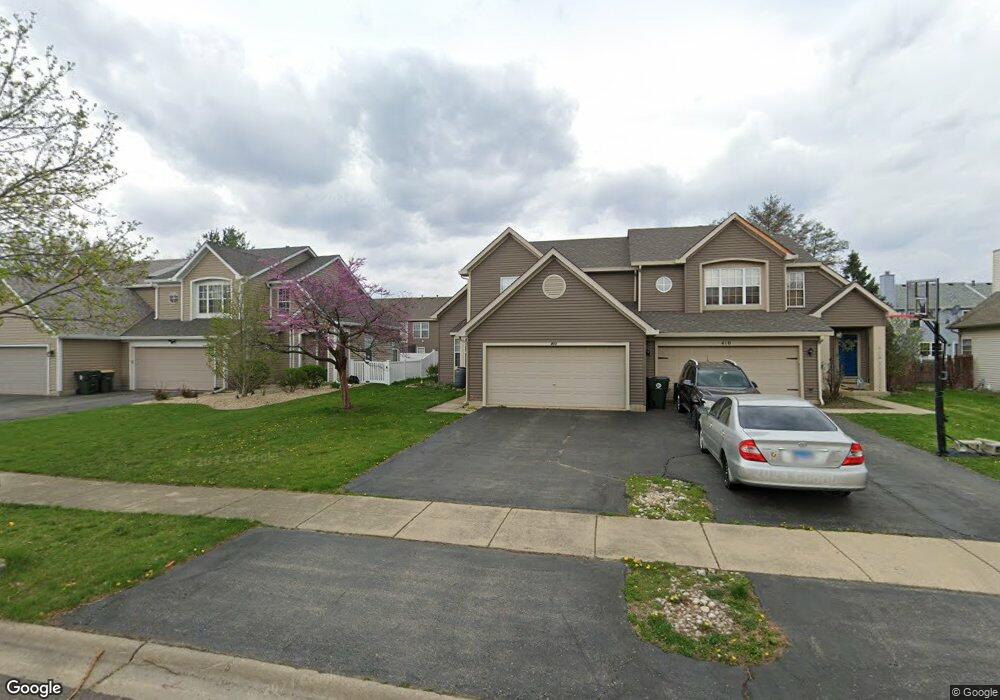
412 Newport Cir Oswego, IL 60543
North Oswego NeighborhoodEstimated Value: $307,000 - $332,000
3
Beds
3
Baths
1,430
Sq Ft
$223/Sq Ft
Est. Value
About This Home
This home is located at 412 Newport Cir, Oswego, IL 60543 and is currently estimated at $319,210, approximately $223 per square foot. 412 Newport Cir is a home located in Kendall County with nearby schools including Long Beach Elementary School, Plank Junior High School, and Oswego East High School.
Ownership History
Date
Name
Owned For
Owner Type
Purchase Details
Closed on
Mar 31, 2011
Sold by
Fisher Kyle S and Fisher Kimberly A
Bought by
Peranich Stephanie L
Current Estimated Value
Home Financials for this Owner
Home Financials are based on the most recent Mortgage that was taken out on this home.
Original Mortgage
$116,000
Outstanding Balance
$5,992
Interest Rate
4.17%
Mortgage Type
New Conventional
Estimated Equity
$313,218
Purchase Details
Closed on
Mar 23, 2001
Sold by
Fielder William S
Bought by
Fisher Kyle S and Fisher Kimberly A
Home Financials for this Owner
Home Financials are based on the most recent Mortgage that was taken out on this home.
Original Mortgage
$132,050
Interest Rate
7.13%
Purchase Details
Closed on
May 29, 1996
Bought by
Fielder William S
Create a Home Valuation Report for This Property
The Home Valuation Report is an in-depth analysis detailing your home's value as well as a comparison with similar homes in the area
Home Values in the Area
Average Home Value in this Area
Purchase History
| Date | Buyer | Sale Price | Title Company |
|---|---|---|---|
| Peranich Stephanie L | $145,000 | Attorneys Title Guaranty Fun | |
| Fisher Kyle S | $139,000 | -- | |
| Fielder William S | $125,000 | -- |
Source: Public Records
Mortgage History
| Date | Status | Borrower | Loan Amount |
|---|---|---|---|
| Open | Peranich Stephanie L | $116,000 | |
| Previous Owner | Fisher Kyle S | $132,050 | |
| Closed | Fielder William S | -- |
Source: Public Records
Tax History Compared to Growth
Tax History
| Year | Tax Paid | Tax Assessment Tax Assessment Total Assessment is a certain percentage of the fair market value that is determined by local assessors to be the total taxable value of land and additions on the property. | Land | Improvement |
|---|---|---|---|---|
| 2024 | $6,561 | $87,531 | $16,148 | $71,383 |
| 2023 | $5,932 | $78,857 | $14,548 | $64,309 |
| 2022 | $5,932 | $71,688 | $13,225 | $58,463 |
| 2021 | $5,707 | $66,998 | $12,360 | $54,638 |
| 2020 | $5,579 | $65,047 | $12,000 | $53,047 |
| 2019 | $5,472 | $63,007 | $12,000 | $51,007 |
| 2018 | $4,795 | $54,422 | $9,662 | $44,760 |
| 2017 | $4,749 | $52,328 | $9,290 | $43,038 |
| 2016 | $4,660 | $50,803 | $9,019 | $41,784 |
| 2015 | $4,477 | $47,040 | $8,351 | $38,689 |
| 2014 | -- | $44,377 | $7,878 | $36,499 |
| 2013 | -- | $44,826 | $7,958 | $36,868 |
Source: Public Records
Map
Nearby Homes
- 0000 Fifth St
- 712 Bohannon Cir
- 232 Julep Ave
- 786 Bohannon Cir
- 790 Bohannon Cir
- 502 Vernon Dr
- 2071 Wiesbrook Dr
- 420 Chesterfield Ct Unit 420
- 633 Henry Ln
- 173 Piper Glen Ave
- 159 Piper Glen Ave
- 174 Piper Glen Ave
- 102 Piper Glen Ave
- 524 Majestic Ln
- 100 Piper Glen Ave
- 215 Fernwood Rd
- 73 Ingleshire Rd
- 4 Circle Ct
- 39 Cayman Dr
- 1468 Vintage Dr
- 414 Newport Cir
- 416 Newport Cir
- 408 Newport Cir
- 454 Newport Cir
- 452 Newport Cir
- 456 Newport Cir
- 418 Newport Cir
- 418 Newport Cir Unit 418
- 406 Newport Cir
- 450 Newport Cir
- 458 Newport Cir
- 442 Newport Cir
- 404 Newport Cir
- 420 Newport Cir
- 460 Newport Cir
- 409 Newport Cir
- 407 Newport Cir
- 411 Newport Cir
- 405 Newport Cir
- 440 Newport Cir