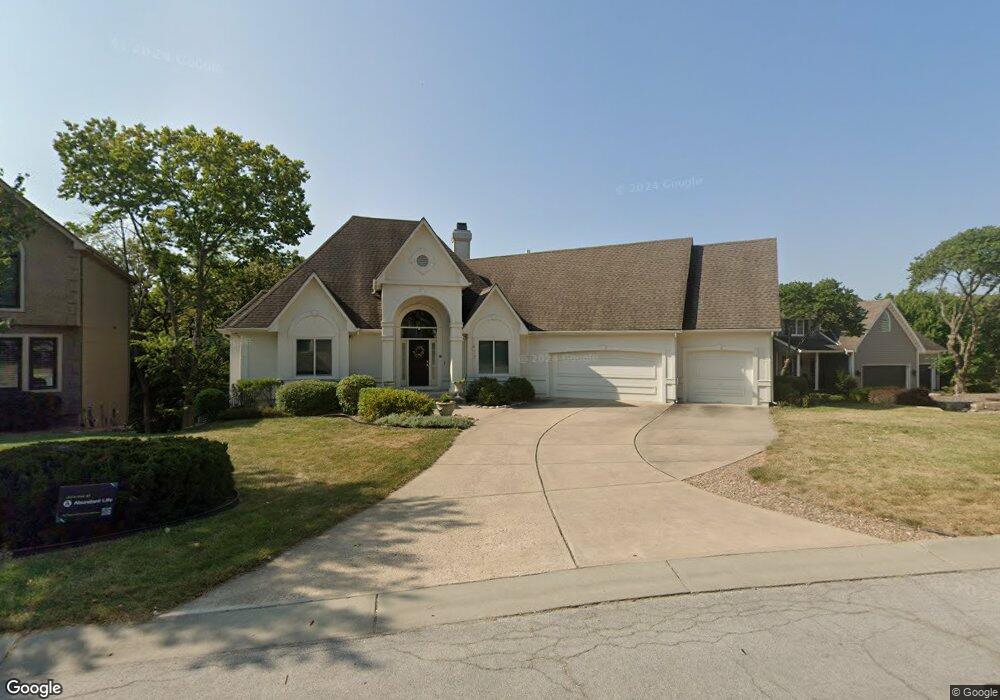
412 NW Highcliffe Dr Lees Summit, MO 64081
Estimated Value: $489,000 - $702,000
4
Beds
4
Baths
3,162
Sq Ft
$200/Sq Ft
Est. Value
About This Home
This home is located at 412 NW Highcliffe Dr, Lees Summit, MO 64081 and is currently estimated at $633,213, approximately $200 per square foot. 412 NW Highcliffe Dr is a home located in Jackson County with nearby schools including Cedar Creek Elementary School, Pleasant Lea Middle School, and Lee's Summit Senior High School.
Ownership History
Date
Name
Owned For
Owner Type
Purchase Details
Closed on
Oct 24, 2023
Sold by
Maryjoan Kenneth L and Maryjoan Johnston
Bought by
Terry Michael Schwatken And Maryjoan Schwatke
Current Estimated Value
Purchase Details
Closed on
May 11, 2011
Sold by
Theiss John L and Theiss Deborah A
Bought by
Schwatken Terry M and Schwatken Linda J
Home Financials for this Owner
Home Financials are based on the most recent Mortgage that was taken out on this home.
Original Mortgage
$236,250
Interest Rate
3.87%
Mortgage Type
New Conventional
Purchase Details
Closed on
Nov 2, 2004
Sold by
Basinger Marcia Coleman
Bought by
Basinger Marcia Coleman and Basinger Stephen Dale
Purchase Details
Closed on
Aug 26, 2004
Sold by
Coleman James
Bought by
Coleman Marcia
Purchase Details
Closed on
Sep 6, 2002
Sold by
Dillenschneider Lance A and Dillenschneider Karen Turner
Bought by
Coleman Marcia A
Purchase Details
Closed on
May 15, 1996
Sold by
Pruente Alois J and Pruente Cheryl A
Bought by
Dillenschneider Lance A
Create a Home Valuation Report for This Property
The Home Valuation Report is an in-depth analysis detailing your home's value as well as a comparison with similar homes in the area
Home Values in the Area
Average Home Value in this Area
Purchase History
| Date | Buyer | Sale Price | Title Company |
|---|---|---|---|
| Terry Michael Schwatken And Maryjoan Schwatke | -- | None Listed On Document | |
| Terry Michael Schwatken And Mary Joan Schwatk | -- | None Listed On Document | |
| Schwatken Terry M | -- | Continental Title | |
| Basinger Marcia Coleman | -- | -- | |
| Coleman Marcia | -- | -- | |
| Coleman Marcia A | -- | Stewart Title | |
| Dillenschneider Lance A | -- | Stewart Title |
Source: Public Records
Mortgage History
| Date | Status | Borrower | Loan Amount |
|---|---|---|---|
| Previous Owner | Schwatken Terry M | $236,250 |
Source: Public Records
Tax History
| Year | Tax Paid | Tax Assessment Tax Assessment Total Assessment is a certain percentage of the fair market value that is determined by local assessors to be the total taxable value of land and additions on the property. | Land | Improvement |
|---|---|---|---|---|
| 2025 | $7,657 | $101,515 | $14,016 | $87,499 |
| 2024 | $7,601 | $106,039 | $19,874 | $86,165 |
| 2023 | $7,601 | $106,039 | $11,955 | $94,084 |
| 2022 | $6,196 | $76,760 | $13,908 | $62,852 |
| 2021 | $6,325 | $76,760 | $13,908 | $62,852 |
| 2020 | $6,087 | $73,150 | $13,908 | $59,242 |
| 2019 | $5,920 | $73,150 | $13,908 | $59,242 |
| 2018 | $5,556 | $63,707 | $7,410 | $56,297 |
| 2017 | $5,556 | $71,013 | $7,410 | $63,603 |
| 2016 | $5,441 | $61,750 | $6,479 | $55,271 |
Source: Public Records
Map
Nearby Homes
- 2122 NW Ashurst Dr
- 433 NW Kaylea Ct
- 2074 NW O'Brien Rd
- 2110 NW Ashurst Dr
- 2070 NW O'Brien Rd
- 334 NW Ambersham Dr
- 2214 NW Killarney Ln
- 2123 NW Killarney Ln
- 2127 NW Killarney Ln
- 507 NW Ashurst Ct
- 2224 NW Summerfield Dr
- 109 SW Drew Ln
- 2430 NW Windwood Dr
- 2635 NW Ashurst Ln
- 2031 SW 4th St
- 1905 SW 3rd St
- 336 NW Thoreau Cir
- 2114 NW Killarney Ln
- 129 NW Morton Dr
- 305 SW Marion Ln
- 408 NW Highcliffe Dr
- 416 NW Highcliffe Dr
- 413 NW Highcliffe Dr
- 420 NW Highcliffe Dr
- 404 NW Highcliffe Dr
- 409 NW Highcliffe Dr
- 424 NW Highcliffe Dr
- 400 NW Highcliffe Dr
- 429 NW Highcliffe Dr
- 405 NW Highcliffe Dr
- 401 NW Highcliffe Dr
- 2213 NW Ashurst Dr
- 428 NW Highcliffe Dr
- 2209 NW Ashurst Dr
- 432 NW Highcliffe Dr
- 2205 NW Ashurst Dr
- 436 NW Highcliffe Dr
- 424 NW Kaylea Ct
- 2033 Ashurst Dr
- 2208 NW Ashurst Dr
Your Personal Tour Guide
Ask me questions while you tour the home.