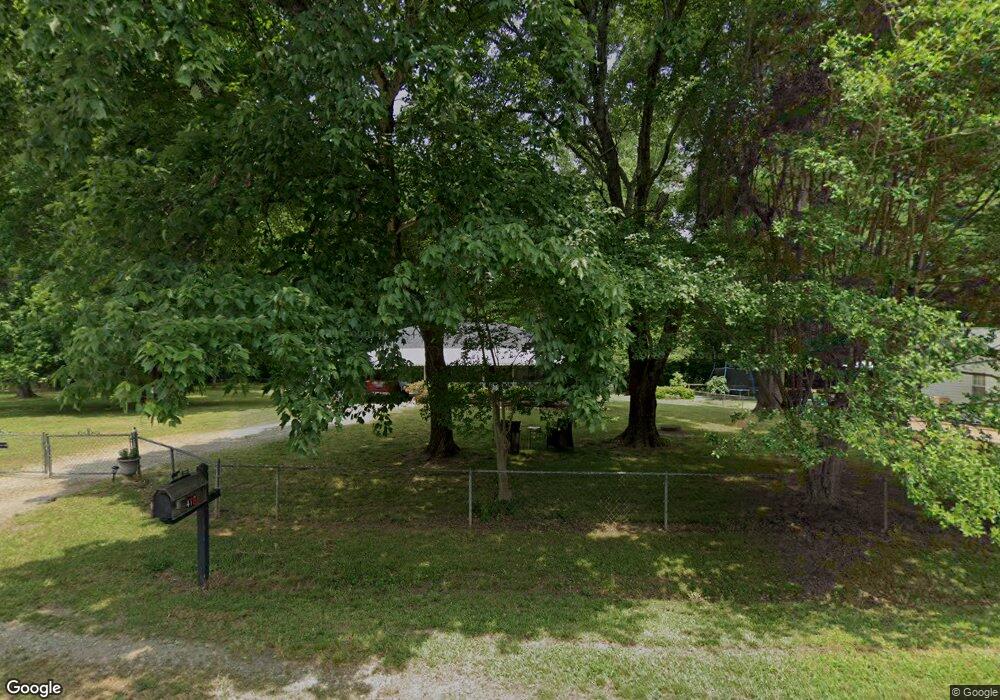
412 Ranch Farm Rd Raleigh, NC 27603
Estimated Value: $249,000 - $292,889
2
Beds
1
Bath
918
Sq Ft
$299/Sq Ft
Est. Value
About This Home
This home is located at 412 Ranch Farm Rd, Raleigh, NC 27603 and is currently estimated at $274,722, approximately $299 per square foot. 412 Ranch Farm Rd is a home located in Wake County with nearby schools including Smith Elementary, North Garner Middle, and Garner High.
Ownership History
Date
Name
Owned For
Owner Type
Purchase Details
Closed on
Mar 5, 2020
Sold by
Temple Donald R and Temple Bethany
Bought by
Sauer Kelly
Current Estimated Value
Home Financials for this Owner
Home Financials are based on the most recent Mortgage that was taken out on this home.
Original Mortgage
$168,780
Outstanding Balance
$149,761
Interest Rate
3.6%
Mortgage Type
New Conventional
Estimated Equity
$124,961
Purchase Details
Closed on
Jul 2, 2015
Sold by
Clayton Family Revocable Trust
Bought by
Temple Don and Temple Bethany
Purchase Details
Closed on
May 10, 2005
Sold by
Clayton Donald Weldon and Clayton Kathleen Vanyo
Bought by
Clayton Donald W and Clayton Kathleen
Purchase Details
Closed on
Oct 17, 2003
Sold by
Clayton Donald Weldon and Clayton Kathleen Vanyo
Bought by
Clayton Donald Weldon and Clayton Kathleen Vanyo
Purchase Details
Closed on
Jul 29, 1993
Bought by
Clayton Donald W and Clayton Kathleen
Create a Home Valuation Report for This Property
The Home Valuation Report is an in-depth analysis detailing your home's value as well as a comparison with similar homes in the area
Home Values in the Area
Average Home Value in this Area
Purchase History
| Date | Buyer | Sale Price | Title Company |
|---|---|---|---|
| Sauer Kelly | $174,000 | None Available | |
| Temple Don | $90,000 | Attorney | |
| Clayton Donald W | -- | -- | |
| Clayton Donald Weldon | -- | -- | |
| Clayton Donald W | $68,000 | -- |
Source: Public Records
Mortgage History
| Date | Status | Borrower | Loan Amount |
|---|---|---|---|
| Open | Sauer Kelly | $168,780 | |
| Closed | Sauer Kelly | $8,000 |
Source: Public Records
Tax History Compared to Growth
Tax History
| Year | Tax Paid | Tax Assessment Tax Assessment Total Assessment is a certain percentage of the fair market value that is determined by local assessors to be the total taxable value of land and additions on the property. | Land | Improvement |
|---|---|---|---|---|
| 2025 | $1,835 | $283,747 | $144,000 | $139,747 |
| 2024 | $1,782 | $283,747 | $144,000 | $139,747 |
| 2023 | $1,141 | $143,811 | $57,600 | $86,211 |
| 2022 | $1,059 | $143,811 | $57,600 | $86,211 |
| 2021 | $1,031 | $143,811 | $57,600 | $86,211 |
| 2020 | $1,014 | $143,811 | $57,600 | $86,211 |
| 2019 | $772 | $92,124 | $36,000 | $56,124 |
| 2018 | $711 | $92,124 | $36,000 | $56,124 |
| 2017 | $675 | $92,124 | $36,000 | $56,124 |
| 2016 | $662 | $92,124 | $36,000 | $56,124 |
| 2015 | -- | $103,448 | $44,000 | $59,448 |
| 2014 | -- | $103,448 | $44,000 | $59,448 |
Source: Public Records
Map
Nearby Homes
- 327 Ranch Farm Rd
- 325 Ranch Farm Rd Unit A / B
- 5107 Overhill St
- 323 Ranch Farm Rd
- 612 Locust Ln
- 721 Grovemont Rd
- 5108 Old Valley St
- 5504 Balsam Place
- 4901 Comelia Dr
- 5515 Spring Rd
- 5505 Spring Rd
- 612 Lakeview Dr
- 1343 Old Buckhorn Rd
- 5716 Spring Rd
- 4408 Parkwood Dr
- 725 Colonial Dr
- Lot 32 Bent Pine Place
- 103 Stonecutter Ct
- 826 Oakwater Dr
- 704 Topleaf Ct
- 410 Ranch Farm Rd
- 510 Ranch Farm Rd
- 408 Ranch Farm Rd
- 512 Ranch Farm Rd
- 415 Ranch Farm Rd
- 419 Ranch Farm Rd
- 411 Ranch Farm Rd
- 514 Ranch Farm Rd
- 505 Ranch Farm Rd
- 427 Grovemont Rd
- 421 Grovemont Rd
- 429 Grovemont Rd
- 419 Grovemont Rd
- 421 Grovemont Rd
- 5301 Juniper Ave
- 5404 Juniper Ave
- 515 Ranch Farm Rd
- 401 Ranch Farm Rd
- 521 Ranch Farm Rd
- 405 Grovemont Rd