P
Seller's Agent in 2013
Phil Doti
SC Real Estate Network
Estimated Value: $436,000 - $510,000
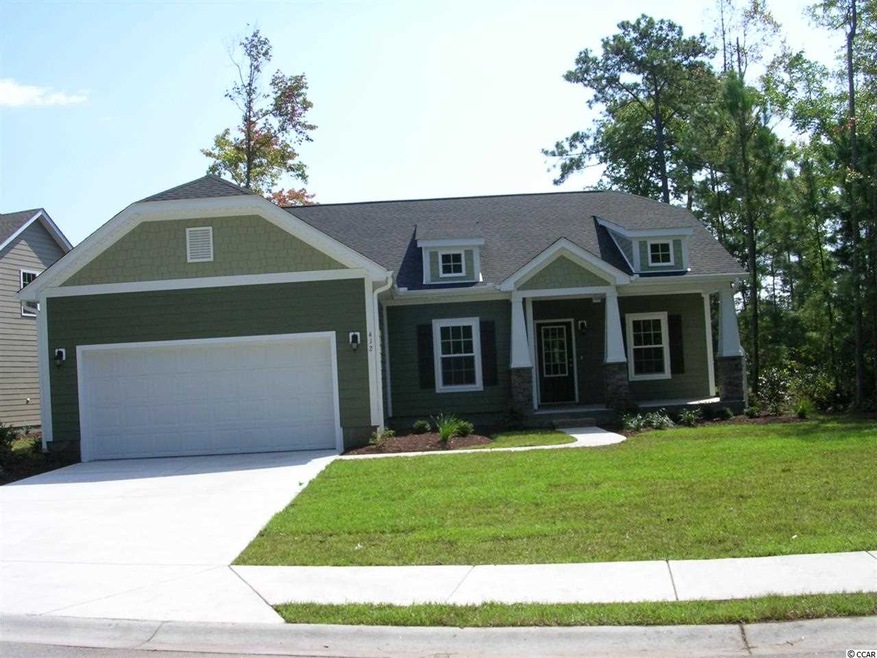
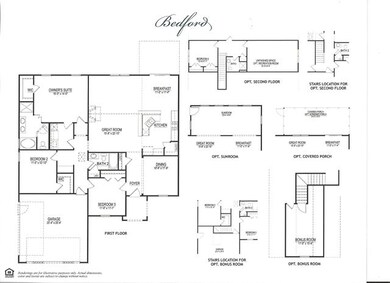
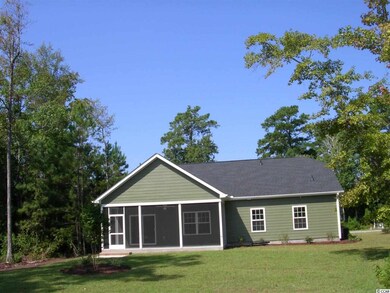
This Bedford model is to be built. It features granite counters, 9' smooth ceilings, 8" baseboard molding, bullnose corners, and a long list of standard features!
Last Agent to Sell the Property
Phil Doti
SC Real Estate Network License #79503 Listed on: 01/29/2013
| Date | Buyer | Sale Price | Title Company |
|---|---|---|---|
| Gallo William J | $223,315 | -- | |
| Gallo William J | $223,315 | -- | |
| Rsp Builders | $28,500 | -- | |
| B & B Properties Of Myrtle Beach Llc | $1,270,455 | None Available |
| Date | Event | Price | List to Sale | Price per Sq Ft |
|---|---|---|---|---|
| 09/17/2013 09/17/13 | Sold | $223,315 | +1.0% | $124 / Sq Ft |
| 01/29/2013 01/29/13 | For Sale | $221,035 | -- | $122 / Sq Ft |
| 01/08/2013 01/08/13 | Pending | -- | -- | -- |
| Year | Tax Paid | Tax Assessment Tax Assessment Total Assessment is a certain percentage of the fair market value that is determined by local assessors to be the total taxable value of land and additions on the property. | Land | Improvement |
|---|---|---|---|---|
| 2024 | $1,108 | $21,562 | $4,260 | $17,302 |
| 2023 | $1,108 | $10,758 | $2,282 | $8,476 |
| 2021 | $4,116 | $28,243 | $5,993 | $22,250 |
| 2020 | $749 | $28,243 | $5,993 | $22,250 |
| 2019 | $656 | $30,973 | $5,993 | $24,980 |
| 2018 | $568 | $21,936 | $3,781 | $18,155 |
| 2017 | -- | $19,595 | $1,440 | $18,155 |
| 2016 | -- | $19,595 | $1,440 | $18,155 |
| 2015 | $718 | $8,357 | $1,441 | $6,916 |
| 2014 | $2,456 | $12,535 | $2,161 | $10,374 |
P
Seller's Agent in 2013
Phil Doti
SC Real Estate Network

Buyer's Agent in 2013
Mike Krokowski
Southbound Realty
(843) 222-3434
11 in this area
37 Total Sales
Source: Coastal Carolinas Association of REALTORS®
MLS Number: 1301774
APN: 46908020046
Disclaimer: Certain information contained herein is derived from information provided by parties other than Homes.com. All information provided is deemed reliable, but is not guaranteed to be accurate and should be independently verified.
![]() Provided courtesy of the Coastal Carolinas MLS. Copyright 2025 of the Coastal Carolinas MLS. All rights reserved. Information is provided exclusively for consumers' personal, non-commercial use, and may not be used for any purpose other than to identify prospective properties consumers may be interested in purchasing, and that the data is deemed reliable but is not guaranteed accurate by the Coastal Carolinas MLS.
Provided courtesy of the Coastal Carolinas MLS. Copyright 2025 of the Coastal Carolinas MLS. All rights reserved. Information is provided exclusively for consumers' personal, non-commercial use, and may not be used for any purpose other than to identify prospective properties consumers may be interested in purchasing, and that the data is deemed reliable but is not guaranteed accurate by the Coastal Carolinas MLS.