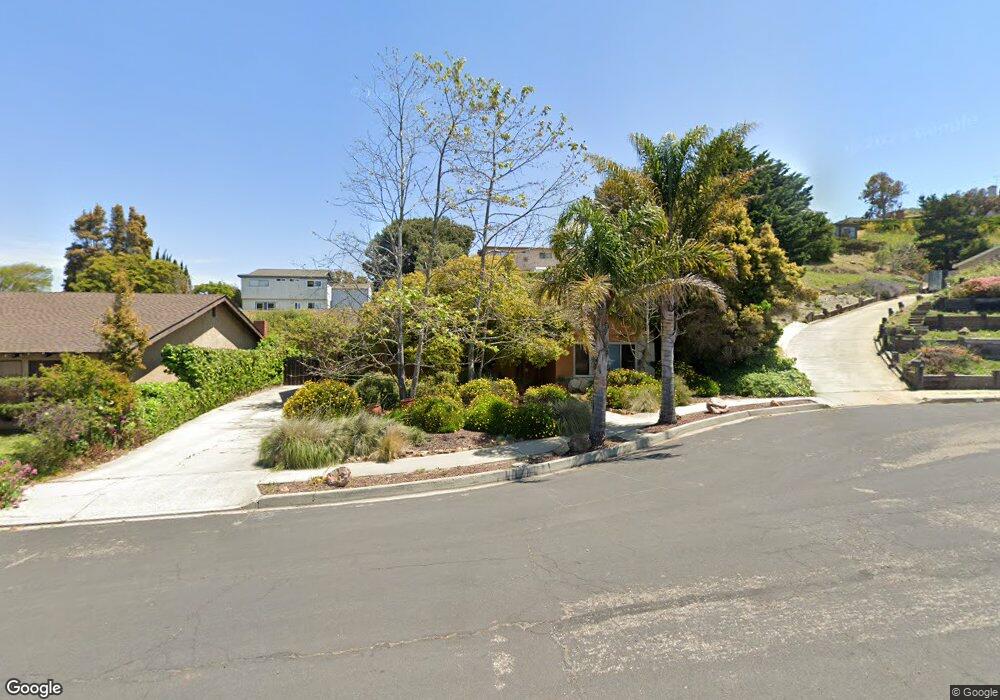
412 S 1st St Lompoc, CA 93436
Estimated Value: $570,135 - $623,000
3
Beds
2
Baths
1,568
Sq Ft
$383/Sq Ft
Est. Value
About This Home
This home is located at 412 S 1st St, Lompoc, CA 93436 and is currently estimated at $600,034, approximately $382 per square foot. 412 S 1st St is a home located in Santa Barbara County with nearby schools including Arthur Hapgood Elementary School, Lompoc Valley Middle School, and Lompoc High School.
Ownership History
Date
Name
Owned For
Owner Type
Purchase Details
Closed on
Mar 8, 2010
Sold by
Fannie Mae
Bought by
Datin Charles C
Current Estimated Value
Purchase Details
Closed on
Mar 6, 2009
Sold by
Siegelin Arthur N and Siegelin Dene
Bought by
Federal National Mortgage Association
Purchase Details
Closed on
Sep 14, 1999
Sold by
Siegelin Arthur N
Bought by
Siegelin Arthur N and Siegelin Dene
Create a Home Valuation Report for This Property
The Home Valuation Report is an in-depth analysis detailing your home's value as well as a comparison with similar homes in the area
Home Values in the Area
Average Home Value in this Area
Purchase History
| Date | Buyer | Sale Price | Title Company |
|---|---|---|---|
| Datin Charles C | $155,000 | Old Republic Title Company | |
| Federal National Mortgage Association | $270,443 | Accommodation | |
| Siegelin Arthur N | -- | -- |
Source: Public Records
Tax History Compared to Growth
Tax History
| Year | Tax Paid | Tax Assessment Tax Assessment Total Assessment is a certain percentage of the fair market value that is determined by local assessors to be the total taxable value of land and additions on the property. | Land | Improvement |
|---|---|---|---|---|
| 2025 | $2,208 | $200,058 | $141,980 | $58,078 |
| 2023 | $2,208 | $192,292 | $136,468 | $55,824 |
| 2022 | $2,169 | $188,523 | $133,793 | $54,730 |
| 2021 | $2,192 | $184,827 | $131,170 | $53,657 |
| 2020 | $2,169 | $182,933 | $129,826 | $53,107 |
| 2019 | $2,133 | $179,347 | $127,281 | $52,066 |
| 2018 | $2,100 | $175,832 | $124,786 | $51,046 |
| 2017 | $2,061 | $172,386 | $122,340 | $50,046 |
| 2016 | $2,024 | $169,007 | $119,942 | $49,065 |
| 2015 | $2,009 | $166,469 | $118,141 | $48,328 |
| 2014 | $1,981 | $163,209 | $115,827 | $47,382 |
Source: Public Records
Map
Nearby Homes
- 1112 E Hickory Ave
- 1200 Peach Ave
- 612 University Dr
- 209 S 7th St
- 1210 E Walnut Ave Unit D
- 801, 851 California 246
- 1416 E Walnut Ave
- 215 S H St
- 225 Princeton Place
- 122 N G St
- 220 N F St
- 224 N F St
- 315 E Chestnut Ave
- 333 S J St
- 117 S I St
- 135 N J St
- 535 Live Oak Rd
- 533 Live Oak Rd
- 1709 River Vista Way
- 1712 River Vista Way