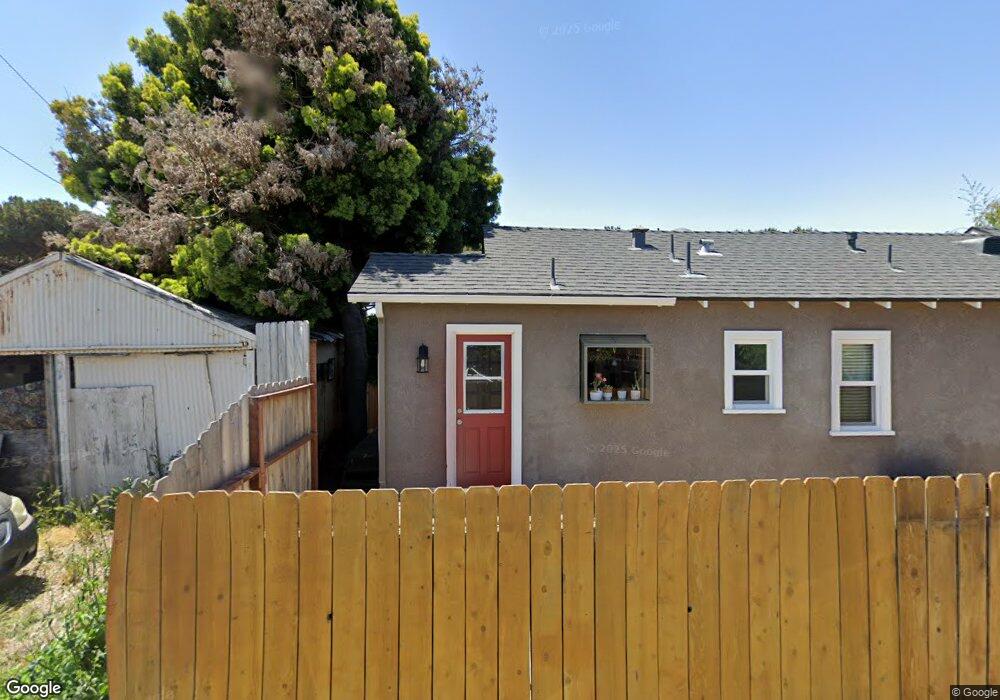
412 S H St Unit B Lompoc, CA 93436
Estimated Value: $479,981 - $521,000
3
Beds
2
Baths
1,669
Sq Ft
$299/Sq Ft
Est. Value
About This Home
This home is located at 412 S H St Unit B, Lompoc, CA 93436 and is currently estimated at $499,495, approximately $299 per square foot. 412 S H St Unit B is a home located in Santa Barbara County with nearby schools including Arthur Hapgood Elementary School, Lompoc Valley Middle School, and Lompoc High School.
Ownership History
Date
Name
Owned For
Owner Type
Purchase Details
Closed on
Sep 23, 2020
Sold by
Reynolds Susan Rae
Bought by
Babcock C William
Current Estimated Value
Purchase Details
Closed on
Dec 14, 2010
Sold by
Reynolds Susan R
Bought by
Reynolds Susan Rae
Purchase Details
Closed on
Aug 4, 2009
Sold by
Reynolds Joseph M
Bought by
Reynolds Joseph M and Reynolds Susan R
Purchase Details
Closed on
Sep 24, 2007
Sold by
Reynolds Joseph M
Bought by
Reynolds Joseph M
Purchase Details
Closed on
Oct 5, 1996
Sold by
Reynolds Joseph M and Reynolds Carol L
Bought by
Reynolds Joseph M and Reynolds Carol L
Purchase Details
Closed on
Jul 19, 1996
Sold by
Andersson Patricia K and Williams Patricia K
Bought by
Reynolds Joseph M and Reynolds Carol L
Create a Home Valuation Report for This Property
The Home Valuation Report is an in-depth analysis detailing your home's value as well as a comparison with similar homes in the area
Home Values in the Area
Average Home Value in this Area
Purchase History
| Date | Buyer | Sale Price | Title Company |
|---|---|---|---|
| Babcock C William | $415,000 | First American Title Company | |
| Reynolds Susan Rae | -- | Orange Coast Title Company | |
| Reynolds Joseph M | -- | None Available | |
| Reynolds Joseph M | -- | First American Title Company | |
| Reynolds Joseph M | -- | First American Title Company | |
| Reynolds Joseph M | -- | -- | |
| Reynolds Joseph M | $129,000 | Chicago Title Co |
Source: Public Records
Tax History
| Year | Tax Paid | Tax Assessment Tax Assessment Total Assessment is a certain percentage of the fair market value that is determined by local assessors to be the total taxable value of land and additions on the property. | Land | Improvement |
|---|---|---|---|---|
| 2025 | $4,875 | $449,207 | $124,478 | $324,729 |
| 2023 | $4,875 | $431,766 | $119,646 | $312,120 |
| 2022 | $4,792 | $423,300 | $117,300 | $306,000 |
| 2021 | $4,847 | $415,000 | $115,000 | $300,000 |
| 2020 | $2,303 | $201,461 | $51,087 | $150,374 |
| 2019 | $2,263 | $197,512 | $50,086 | $147,426 |
| 2018 | $2,226 | $193,640 | $49,104 | $144,536 |
| 2017 | $2,184 | $189,844 | $48,142 | $141,702 |
| 2016 | $2,143 | $186,123 | $47,199 | $138,924 |
| 2015 | $2,126 | $183,329 | $46,491 | $136,838 |
| 2014 | -- | $179,739 | $45,581 | $134,158 |
Source: Public Records
Map
Nearby Homes
Your Personal Tour Guide
Ask me questions while you tour the home.