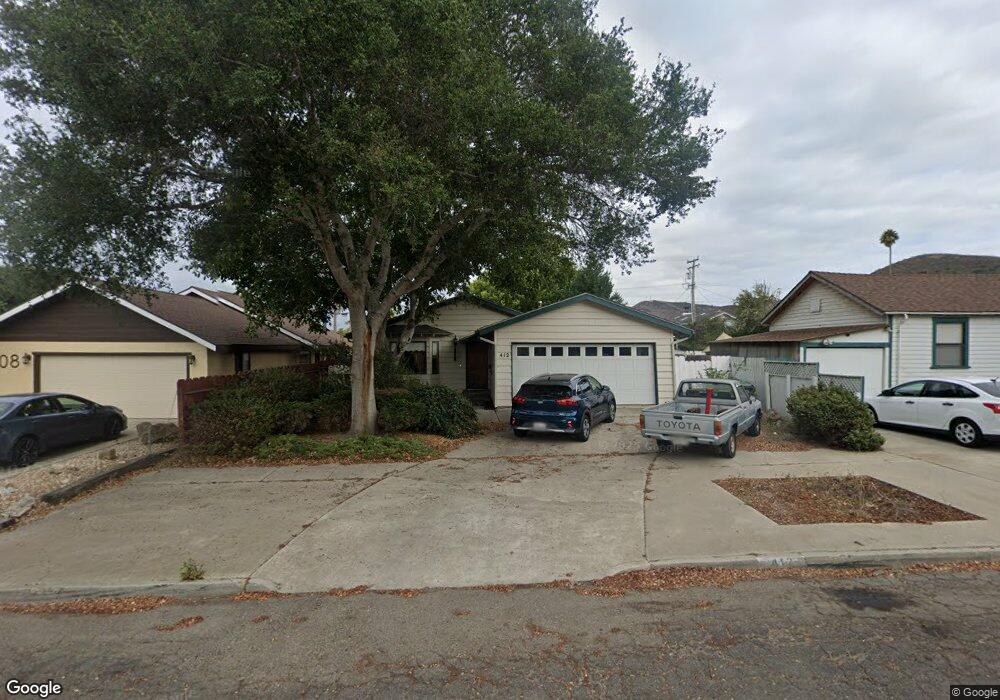
412 S K St Lompoc, CA 93436
Estimated Value: $518,221 - $604,000
3
Beds
2
Baths
1,404
Sq Ft
$408/Sq Ft
Est. Value
About This Home
This home is located at 412 S K St, Lompoc, CA 93436 and is currently estimated at $572,805, approximately $407 per square foot. 412 S K St is a home located in Santa Barbara County with nearby schools including Arthur Hapgood Elementary School, Lompoc Valley Middle School, and Lompoc High School.
Ownership History
Date
Name
Owned For
Owner Type
Purchase Details
Closed on
Mar 20, 2018
Sold by
Allen David and Allen Amy L
Bought by
Lizarraga John Peter and The John Peter Lizarraga And P
Current Estimated Value
Home Financials for this Owner
Home Financials are based on the most recent Mortgage that was taken out on this home.
Original Mortgage
$297,600
Interest Rate
4.43%
Mortgage Type
New Conventional
Purchase Details
Closed on
Nov 5, 2004
Sold by
Miller Amy L and Allen Amy L
Bought by
Allen David and Allen Amy L
Purchase Details
Closed on
May 27, 2003
Sold by
Allen David
Bought by
Miller Amy L
Home Financials for this Owner
Home Financials are based on the most recent Mortgage that was taken out on this home.
Original Mortgage
$87,000
Interest Rate
5.05%
Mortgage Type
Purchase Money Mortgage
Create a Home Valuation Report for This Property
The Home Valuation Report is an in-depth analysis detailing your home's value as well as a comparison with similar homes in the area
Home Values in the Area
Average Home Value in this Area
Purchase History
| Date | Buyer | Sale Price | Title Company |
|---|---|---|---|
| Lizarraga John Peter | $372,000 | Fidelity National Title Co | |
| Allen David | -- | -- | |
| Miller Amy L | -- | Chicago Title Co |
Source: Public Records
Mortgage History
| Date | Status | Borrower | Loan Amount |
|---|---|---|---|
| Previous Owner | Lizarraga John Peter | $297,600 | |
| Previous Owner | Miller Amy L | $87,000 |
Source: Public Records
Tax History
| Year | Tax Paid | Tax Assessment Tax Assessment Total Assessment is a certain percentage of the fair market value that is determined by local assessors to be the total taxable value of land and additions on the property. | Land | Improvement |
|---|---|---|---|---|
| 2025 | $1,210 | $114,597 | $23,470 | $91,127 |
| 2023 | $1,210 | $110,149 | $22,559 | $87,590 |
| 2022 | $1,185 | $107,990 | $22,117 | $85,873 |
| 2021 | $1,194 | $105,874 | $21,684 | $84,190 |
| 2020 | $1,181 | $104,789 | $21,462 | $83,327 |
| 2019 | $1,159 | $102,736 | $21,042 | $81,694 |
| 2018 | $2,642 | $229,205 | $74,200 | $155,005 |
| 2017 | $2,592 | $224,712 | $72,746 | $151,966 |
| 2016 | $2,544 | $220,307 | $71,320 | $148,987 |
| 2014 | $2,487 | $212,749 | $68,873 | $143,876 |
Source: Public Records
Map
Nearby Homes
- 403 S M St
- 215 S H St
- 117 S I St
- 413 S O Place
- 801, 851 California 246
- 616 University Dr
- 217 N M St
- 321 N K St
- 319 S B St
- 1220 W Lime Ave
- 23 Village Circle Dr
- 1011 W Walnut Ave
- 113 N B St
- 230 N D St
- 225 Village Circle Dr
- 60 Village Circle Dr
- 267 Village Circle Dr
- 510 N I St
- 1410 W Apricot Ave
- 526 N L St
Your Personal Tour Guide
Ask me questions while you tour the home.