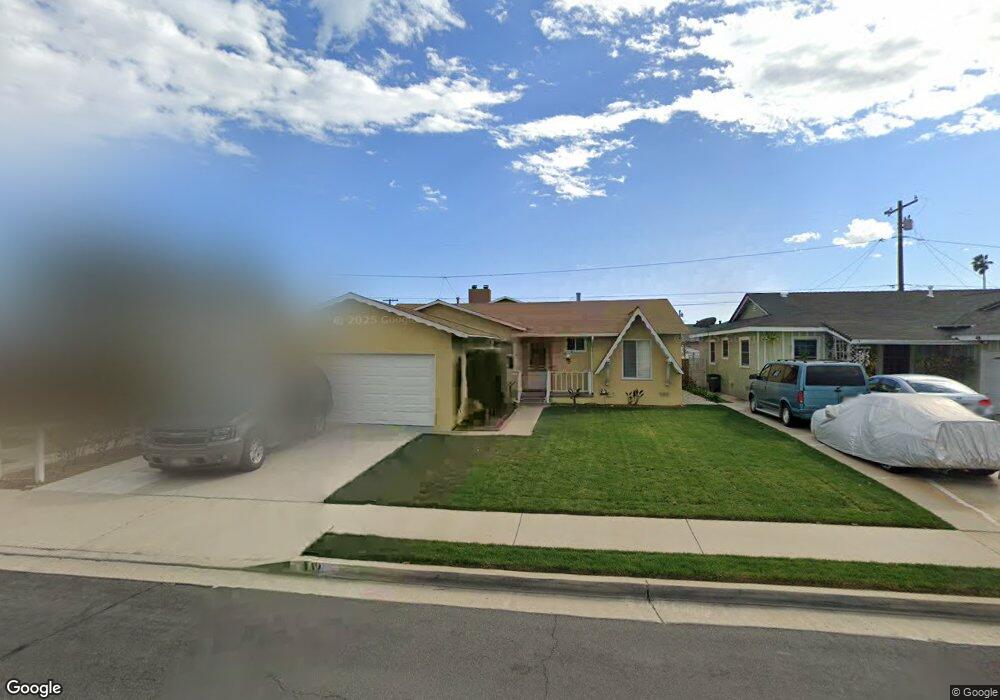
412 W 230th St Carson, CA 90745
Estimated Value: $743,000 - $823,000
3
Beds
2
Baths
1,285
Sq Ft
$607/Sq Ft
Est. Value
About This Home
This home is located at 412 W 230th St, Carson, CA 90745 and is currently estimated at $780,238, approximately $607 per square foot. 412 W 230th St is a home located in Los Angeles County with nearby schools including 232nd Place School, Stephen M. White Middle School, and Academies Of Education And Empowerment.
Ownership History
Date
Name
Owned For
Owner Type
Purchase Details
Closed on
Jun 27, 2018
Sold by
Rogers Richard S
Bought by
Rogers Richard Stanley and Rogers Doris Marie
Current Estimated Value
Purchase Details
Closed on
Jul 19, 2002
Sold by
Cowen Debra M
Bought by
Cowen John C
Home Financials for this Owner
Home Financials are based on the most recent Mortgage that was taken out on this home.
Original Mortgage
$197,000
Outstanding Balance
$75,536
Interest Rate
5.37%
Estimated Equity
$704,702
Purchase Details
Closed on
Jul 15, 2002
Sold by
Cowen John C
Bought by
Rogers Richard S
Home Financials for this Owner
Home Financials are based on the most recent Mortgage that was taken out on this home.
Original Mortgage
$197,000
Outstanding Balance
$75,536
Interest Rate
5.37%
Estimated Equity
$704,702
Purchase Details
Closed on
Dec 15, 2000
Sold by
Cowen John C and The Trust Of Marian C Cowen
Bought by
Cowen John C
Create a Home Valuation Report for This Property
The Home Valuation Report is an in-depth analysis detailing your home's value as well as a comparison with similar homes in the area
Home Values in the Area
Average Home Value in this Area
Purchase History
| Date | Buyer | Sale Price | Title Company |
|---|---|---|---|
| Rogers Richard Stanley | -- | None Available | |
| Cowen John C | -- | First American Title Co | |
| Rogers Richard S | $257,000 | First American Title Co | |
| Cowen John C | -- | -- |
Source: Public Records
Mortgage History
| Date | Status | Borrower | Loan Amount |
|---|---|---|---|
| Open | Rogers Richard S | $197,000 |
Source: Public Records
Tax History
| Year | Tax Paid | Tax Assessment Tax Assessment Total Assessment is a certain percentage of the fair market value that is determined by local assessors to be the total taxable value of land and additions on the property. | Land | Improvement |
|---|---|---|---|---|
| 2025 | $5,011 | $372,198 | $244,176 | $128,022 |
| 2024 | $5,011 | $364,901 | $239,389 | $125,512 |
| 2023 | $4,915 | $357,747 | $234,696 | $123,051 |
| 2022 | $4,677 | $350,734 | $230,095 | $120,639 |
| 2021 | $4,622 | $343,858 | $225,584 | $118,274 |
| 2019 | $4,461 | $333,661 | $218,894 | $114,767 |
| 2018 | $4,367 | $327,119 | $214,602 | $112,517 |
| 2016 | $4,167 | $314,419 | $206,270 | $108,149 |
| 2015 | $4,088 | $309,697 | $203,172 | $106,525 |
| 2014 | $4,080 | $303,632 | $199,193 | $104,439 |
Source: Public Records
Map
Nearby Homes
- 424 W 230th St
- 22832 Menlo Ave
- 802 W 229th St
- 23200 Sesame St Unit D
- 23204 Sesame St Unit C
- 803 W 232nd St Unit C
- 803 W 228th St Unit 1
- 22906 S Vermont Ave
- 23020 S Vermont Ave
- 23314 S Vermont Ave
- 802 Coriander Dr Unit B
- 23304 Sesame St Unit 16R
- 23334 Sesame St Unit E
- 806 Coriander Dr Unit C
- 826 Coriander Dr Unit D
- 812 Coriander Dr Unit F
- 23314 Sesame St Unit D
- 939 Belson St
- 208 W 234th Place
- 434 W 223rd St
- 418 W 230th St
- 408 W 230th St
- 413 W 231st St
- 23003 Caroldale Ave
- 407 W 231st St
- 419 W 231st St
- 413 W 230th St
- 425 W 231st St
- 23015 Caroldale Ave Unit n/a
- 23015 Caroldale Ave
- 407 W 230th St
- 419 W 230th St
- 428 W 230th St
- 423 W 230th St
- 22919 Caroldale Ave
- 429 W 231st St
- 429 W 230th St
- 434 W 230th St
- 412 W 229th St
- 412 W 231st St
Your Personal Tour Guide
Ask me questions while you tour the home.