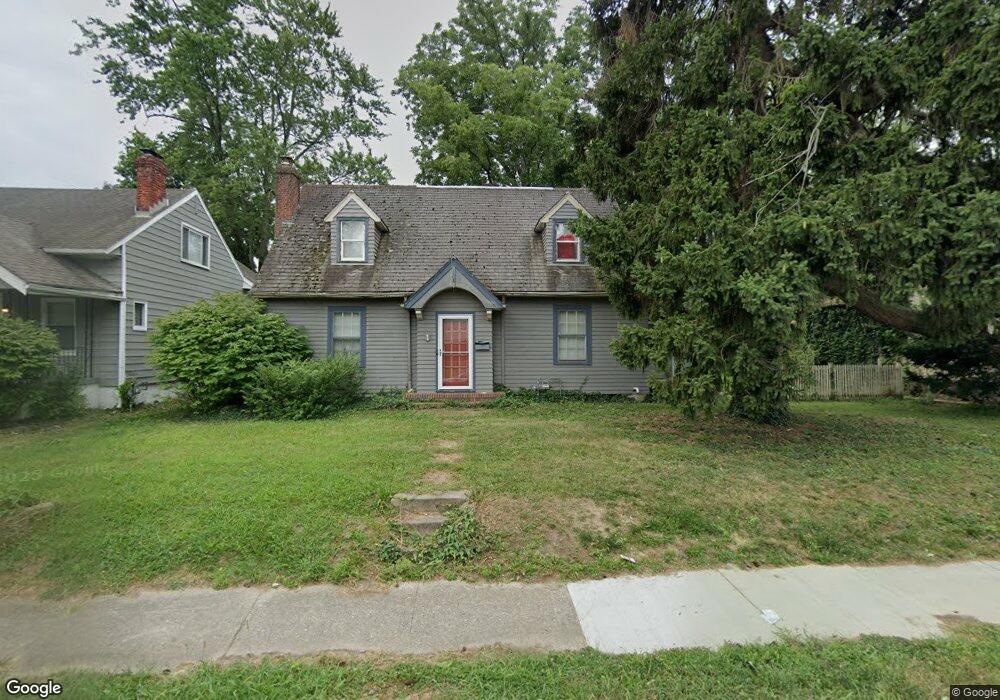
412 W Hillcrest Ave Dayton, OH 45406
Hillcrest NeighborhoodEstimated Value: $104,457 - $160,000
3
Beds
2
Baths
1,558
Sq Ft
$82/Sq Ft
Est. Value
About This Home
This home is located at 412 W Hillcrest Ave, Dayton, OH 45406 and is currently estimated at $128,114, approximately $82 per square foot. 412 W Hillcrest Ave is a home located in Montgomery County with nearby schools including Valerie Elementary School, Deca Prep, and Imagine Klepinger Road Community School.
Ownership History
Date
Name
Owned For
Owner Type
Purchase Details
Closed on
Jun 8, 2018
Sold by
Algee Wendell
Bought by
Tucker Dale
Current Estimated Value
Purchase Details
Closed on
Jun 6, 2018
Sold by
Bermah Patty L
Bought by
Algee Ii Wendall O
Purchase Details
Closed on
Feb 24, 2017
Sold by
Estate Of Kenneth L Atwater Jr
Bought by
Beeman Patty L
Purchase Details
Closed on
Aug 5, 2014
Sold by
Wells Fargo Bank Na
Bought by
Secretary Of Housing & Urban Development
Purchase Details
Closed on
Apr 11, 2014
Sold by
Gullatte Xavier M
Bought by
Wells Fargo Bank Na
Purchase Details
Closed on
Sep 30, 1999
Sold by
Mescher Angela C
Bought by
Gullatte Xavier M and Ward Michelle L
Home Financials for this Owner
Home Financials are based on the most recent Mortgage that was taken out on this home.
Original Mortgage
$79,652
Interest Rate
7.93%
Mortgage Type
FHA
Create a Home Valuation Report for This Property
The Home Valuation Report is an in-depth analysis detailing your home's value as well as a comparison with similar homes in the area
Home Values in the Area
Average Home Value in this Area
Purchase History
| Date | Buyer | Sale Price | Title Company |
|---|---|---|---|
| Tucker Dale | $44,400 | None Available | |
| Algee Ii Wendall O | $44,400 | None Available | |
| Beeman Patty L | -- | None Available | |
| Secretary Of Housing & Urban Development | -- | Attorney | |
| Wells Fargo Bank Na | $12,000 | None Available | |
| Gullatte Xavier M | $79,900 | -- |
Source: Public Records
Mortgage History
| Date | Status | Borrower | Loan Amount |
|---|---|---|---|
| Previous Owner | Gullatte Xavier M | $79,652 |
Source: Public Records
Tax History
| Year | Tax Paid | Tax Assessment Tax Assessment Total Assessment is a certain percentage of the fair market value that is determined by local assessors to be the total taxable value of land and additions on the property. | Land | Improvement |
|---|---|---|---|---|
| 2025 | $1,121 | $19,270 | $5,470 | $13,800 |
| 2024 | $1,092 | $19,270 | $5,470 | $13,800 |
| 2023 | $1,092 | $19,270 | $5,470 | $13,800 |
| 2022 | $1,300 | $14,820 | $4,210 | $10,610 |
| 2021 | $1,080 | $14,820 | $4,210 | $10,610 |
| 2020 | $1,078 | $14,820 | $4,210 | $10,610 |
| 2019 | $1,259 | $15,510 | $4,210 | $11,300 |
| 2018 | $1,293 | $15,510 | $4,210 | $11,300 |
| 2017 | $1,344 | $15,510 | $4,210 | $11,300 |
| 2016 | $1,541 | $17,820 | $4,210 | $13,610 |
| 2015 | $1,455 | $17,820 | $4,210 | $13,610 |
| 2014 | $1,455 | $17,820 | $4,210 | $13,610 |
| 2012 | -- | $22,250 | $5,620 | $16,630 |
Source: Public Records
Map
Nearby Homes
- 2331 Rugby Rd
- 2302 Rustic Rd
- 257 Valleyview Dr
- 245 Valleyview Dr
- 714 Mccleary Ave Unit 716
- 719 W Fairview Ave
- 523 Imo Dr
- 427 Sandalwood Dr
- 423 Sandalwood Dr
- 417 Sandalwood Dr
- 716 W Fairview Ave
- 2532 Ravenwood Ave
- 2536 Ravenwood Ave
- 148 Valleyview Dr
- 117 Valleyview Dr
- 2118 Catalpa Dr
- 2136 Ravenwood Ave
- 513 W Fairview Ave
- 2110 Catalpa Dr
- 30 Kurtz Ave
- 408 W Hillcrest Ave
- 420 W Hillcrest Ave
- 406 W Hillcrest Ave
- 400 W Hillcrest Ave
- 424 W Hillcrest Ave
- 2370 Emerson Ave
- 2381 Rustic Rd
- 2366 Emerson Ave
- 415 W Hillcrest Ave
- 2362 Emerson Ave
- 417 W Hillcrest Ave
- 405 W Hillcrest Ave
- 500 W Hillcrest Ave
- 2360 Emerson Ave
- 348 W Hillcrest Ave
- 425 W Hillcrest Ave
- 333 W Hillcrest Ave
- 429 W Hillcrest Ave
- 504 W Hillcrest Ave
- 2354 Emerson Ave
Your Personal Tour Guide
Ask me questions while you tour the home.