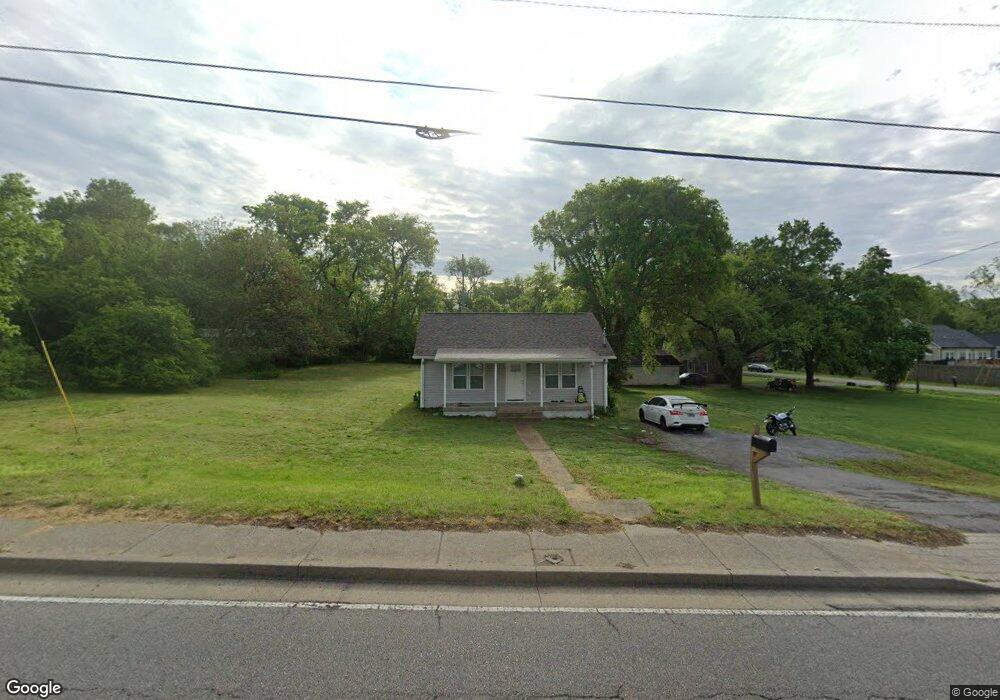
4120 Old Hickory Blvd Old Hickory, TN 37138
Hermitage NeighborhoodEstimated Value: $312,365 - $338,000
3
Beds
2
Baths
1,248
Sq Ft
$264/Sq Ft
Est. Value
About This Home
This home is located at 4120 Old Hickory Blvd, Old Hickory, TN 37138 and is currently estimated at $329,341, approximately $263 per square foot. 4120 Old Hickory Blvd is a home located in Davidson County with nearby schools including Andrew Jackson Elementary School, Dupont-Hadley Middle School, and McGavock High School.
Ownership History
Date
Name
Owned For
Owner Type
Purchase Details
Closed on
Jul 13, 2022
Sold by
Music City Handymen Llc
Bought by
Mch Property Management Llc
Current Estimated Value
Purchase Details
Closed on
Nov 15, 2019
Sold by
Lcrs Lp
Bought by
Music Cituy Handyman Llc
Home Financials for this Owner
Home Financials are based on the most recent Mortgage that was taken out on this home.
Original Mortgage
$362,000
Interest Rate
3.5%
Mortgage Type
Unknown
Purchase Details
Closed on
Oct 25, 2019
Sold by
Sanford Ronald L and Sanford Carl W
Bought by
Sanford Ronald L and Donaldson Estelle
Home Financials for this Owner
Home Financials are based on the most recent Mortgage that was taken out on this home.
Original Mortgage
$362,000
Interest Rate
3.5%
Mortgage Type
Unknown
Purchase Details
Closed on
Jun 27, 2019
Sold by
Sanford Leonard B
Bought by
Sanford Ronald L and Sanford Carl W
Create a Home Valuation Report for This Property
The Home Valuation Report is an in-depth analysis detailing your home's value as well as a comparison with similar homes in the area
Home Values in the Area
Average Home Value in this Area
Purchase History
| Date | Buyer | Sale Price | Title Company |
|---|---|---|---|
| Mch Property Management Llc | -- | -- | |
| Music Cituy Handyman Llc | $452,500 | None Available | |
| Sanford Ronald L | -- | None Available | |
| Sanford Ronald L | -- | None Available |
Source: Public Records
Mortgage History
| Date | Status | Borrower | Loan Amount |
|---|---|---|---|
| Previous Owner | Music Cituy Handyman Llc | $362,000 |
Source: Public Records
Tax History Compared to Growth
Tax History
| Year | Tax Paid | Tax Assessment Tax Assessment Total Assessment is a certain percentage of the fair market value that is determined by local assessors to be the total taxable value of land and additions on the property. | Land | Improvement |
|---|---|---|---|---|
| 2024 | $1,369 | $46,850 | $10,450 | $36,400 |
| 2023 | $1,369 | $46,850 | $10,450 | $36,400 |
| 2022 | $1,369 | $46,850 | $10,450 | $36,400 |
| 2021 | $845 | $28,625 | $10,450 | $18,175 |
| 2020 | $977 | $25,800 | $10,450 | $15,350 |
| 2019 | $711 | $25,800 | $10,450 | $15,350 |
| 2018 | $711 | $25,800 | $10,450 | $15,350 |
| 2017 | $711 | $25,800 | $10,450 | $15,350 |
| 2016 | $901 | $22,950 | $10,450 | $12,500 |
| 2015 | $901 | $22,950 | $10,450 | $12,500 |
| 2014 | $596 | $22,950 | $10,450 | $12,500 |
Source: Public Records
Map
Nearby Homes
- 4209 Woods St
- 4211 Woods St
- 4122 Union St
- 127D Commerce St
- 204 Commerce St
- 220 Center St
- 4248 Old Hickory Blvd
- 4252 Woods St
- 4114 Main St
- 405 Laurel Hill Dr
- 601 Laurel Hill Dr
- 4310 Old Hickory Blvd
- 1608 Aaronwood Dr
- 1416 Station Four Ln
- 4024 Lafayette Ave
- 1413 Station Four Ln
- 5016 Southfork Blvd
- 1145 Cleveland Hall Blvd
- 314 Capital St
- 4512 S Trace Blvd
- 4112 Old Hickory Blvd
- 110 6th St
- 4203 Woods St
- 4117 Old Hickory Blvd
- 4205 Woods St
- 0 Woods St
- 0 Woods St Unit RTC2005235
- 0 Woods St Unit RTC1948363
- 0 Woods St Unit RTC2029884
- 0 Woods St Unit 2045657
- 0 Woods St Unit 2167247
- 4113 Old Hickory Blvd
- 4207 Woods St
- 4109 Old Hickory Blvd
- 4206 Old Hickory Blvd
- 109 Commerce St
- 4103 Old Hickory Blvd
- 3 Center St
- 4 Center St
- 5 Center St